Introduction
The European renewable energy landscape is experiencing an unprecedented structural shift. According to the International Energy Agency (IEA) Global Energy Review 2026, the European Union added a record-breaking 85 GW of new renewable capacity in 2025, with solar PV leading the charge at nearly 70 GW. For institutional investors, commercial entities, and utility developers navigating this rapid expansion, understanding the precise Solar EPC Cost dynamics is paramount to ensuring project bankability and long-term financial viability. Managing the upfront Engineering, Procurement, and Construction expenses while balancing technological efficiency dictates the trajectory of your Levelized Cost of Energy (LCOE) and asset reliability across its 25+ year lifecycle.
Solar EPC Cost Explained – What Is Included in a Solar EPC Project?
Featured Snippet Answer:
Solar EPC Cost refers to the total project expenditure required for Engineering, Procurement, and Construction of a solar power plant. It typically includes system design, solar modules, inverters, mounting structures, civil works, electrical installation, grid connection, commissioning, project management, and warranty services. The final Solar EPC Cost per MW varies depending on project size, location, equipment quality, and labor costs.
What Does Solar EPC Cost Cover?
A comprehensive turnkey solar EPC pricing for industrial projects encapsulates every phase of execution, mitigating the developer’s execution risks by shifting liabilities to a single principal contractor. The total investment structure covers several critical areas:
- Engineering and feasibility studies: Geotechnical assessments, structural layout design, advanced electrical engineering, yield simulation, and full 3D shading profiling using specialized modeling software.
- Procurement of solar equipment: Strategic sourcing of high-tier PV modules, advanced inverters, smart tracking systems or fixed racking, medium-voltage transformers, and high-performance balance of system (BOS) components.
- Civil and electrical construction: Site preparation, grading, trenching, structural foundation driven-piles or ballasted installation, DC/AC cabling, inverter substation deployment, and structural bonding.
- Grid interconnection: High-voltage or medium-voltage substation expansion, telemetry setup, supervisory control and data acquisition (SCADA) systems integration, and strict compliance alignment with regional European transmission system operators (TSOs) or distribution system operators (DSOs).
- Testing and commissioning: Performance ratio (PR) testing, insulation resistance tests, thermographic drone profiling, grid compliance simulation, and multi-stage witness testing.
- Project management: Continuous site logistics, quality control, adherence to strict European health and safety regulations (such as OHSAS standards), permitting management, and regular stakeholder reporting.
- Warranty and quality assurance: Provision of systematic defect liability periods, system performance ratio guarantees, and original equipment manufacturer (OEM) warranty back-to-back structuring.
Why Understanding Solar EPC Cost Matters
In the highly competitive European energy market, a vague solar project budget estimation can lead to severe capital shortfalls or unviable bids in renewable energy auctions. Precise understanding of the Solar EPC Contractor Cost facilitates:
- Budget planning: Prevents mid-project capital expenditure (CAPEX) overruns by capturing hidden infrastructure costs early.
- Investor decision-making: Delivers precise financial metrics to equity partners and debt financing institutions.
- Project bankability: High-tier component integration coupled with transparent cost breakdowns ensures smooth non-recourse project financing.
- Long-term ROI forecasting: Allows asset managers to model true operational expenditures (OPEX) and calculate accurate equity internal rates of return (IRR).
Solar EPC Cost per MW in Europe
Average Utility-Scale Solar EPC Cost per MW in Europe
European utility-scale Solar EPC Pricing has stabilized following the supply chain rebalancings of previous years, driven by significant drops in upstream material costs and a massive influx of manufacturing capacity. The typical cost curves display pronounced economies of scale across different capacity thresholds.
Cost Range by Project Size (2026 Benchmarks)
- 1 MW Solar Plant: €750,000 to €920,000 per MW (Typical for commercial and industrial grid-tied installations).
- 5 MW Solar Plant: €640,000 to €780,000 per MW (Mid-scale regional distribution network grid connections).
- 10 MW Solar Plant: €560,000 to €680,000 per MW (Large-scale industrial clusters or localized utility configurations).
- 50 MW+ Utility Scale Projects: €480,000 to €590,000 per MW (Substation-scale generation directly feeding transmission networks).
Regional Cost Variations
The actual commercial solar EPC project cost varies across European micro-markets due to disparate labor rates, regulatory complexities, grid constraints, and structural terrain variances:
- Western Europe (Germany, France): Higher labor costs and rigorous environmental impact permitting drive costs toward the higher end of the spectrum (€650,000 – €850,000/MW for mid-scale utility). However, high grid stability reduces connection risk.
- Southern Europe (Spain, Italy): Highly optimized market conditions with extensive developer ecosystems. Excellent solar irradiance profiles drive a massive volume of utility scale solar EPC cost estimate requests, averaging €500,000 – €620,000/MW for large-scale projects. Spain added a record 14 GW of solar PV additions in 2025 alone, indicating a mature supply chain.
- Eastern Europe (Poland, Romania): Emerging hotspots with highly competitive civil labor costs. Projects face moderate grid constraints, leading to average costs of €530,000 – €670,000/MW.
- Nordic Countries (Sweden, Norway): Challenging geotechnical conditions (rocky terrain, high snow load requirements) push structural engineering costs higher, averaging €720,000 – €900,000/MW, mitigated by high hydro-balancing synergy.
Typical Solar EPC Cost Breakdown per MW
To optimize a solar farm development cost, developers must scrutinize the percentage weight of each system element. The table below outlines a typical hardware and soft-cost breakdown for a standard 10 MW ground-mounted system in Europe:
| Cost Category | Share of Total EPC Cost (%) | Estimated Cost per MW (€) | Key Drivers & Variations |
|---|---|---|---|
| Solar Modules | 32% – 38% | €192,000 – €228,000 | n-type TOPCon vs. HJT technology, bulk shipping logistics. |
| Inverters & Power Electronics | 8% – 11% | €48,000 – €66,000 | String inverters vs. centralized multi-megawatt stations. |
| Mounting Structures / Trackers | 9% – 13% | €54,000 – €78,000 | Fixed-tilt arrays vs. single-axis smart tracking systems. |
| Civil Works & Site Preparation | 10% – 14% | €60,000 – €84,000 | Clearing, grading, perimeter fencing, roads, piling conditions. |
| Electrical Works & Substation | 12% – 16% | €72,000 – €96,000 | DC/AC cabling, MV switchgear, transformer stations, SCADA. |
| Engineering & Permitting | 4% – 6% | €24,000 – €36,000 | Environmental studies, detailed design, structural certifications. |
| Project Management & Contingency | 5% – 7% | €30,000 – €42,000 | Logistics tracking, site safety, inflation hedging provisions. |
Solar EPC Cost Trends in the European Market
- Impact of module pricing: Global manufacturing expansions have driven module costs to historic lows, shifting the capital weight of a Solar Project Cost toward civil labor and grid infrastructure.
- Impact of labor costs: European inflationary pressures have elevated skilled electrical labor and civil engineering costs by 12% to 15% across Western Europe, emphasizing the need for faster installation methods.
- Impact of energy policies: The EU Net-Zero Industry Act accelerates permitting pathways for priority zones, reducing the capital tied up in elongated pre-construction development phases.
- Impact of grid connection requirements: Grid capacity saturation across core European nodes has mandated stricter grid-code compliance, increasing the cost of substation harmonics filtering, reactive power compensation systems, and high-voltage protection equipment.
Solar EPC Project Cost Variations by Project Type
Utility-Scale Solar Project EPC Cost
Large utility installations focus heavily on maximizing output density and achieving the absolute lowest utility scale solar EPC cost estimate. These systems are highly standardized, utilizing multi-megawatt central inverters and ground-mounted racking to extract maximum efficiencies.
- Typical Project Characteristics: 20 MW to 100 MW+ capacities, high-voltage grid injection (110kV – 400kV), expansive rural land footprints, and long-term Power Purchase Agreements (PPAs) or feed-in premium structures.
- EPC Cost Structure: Highly weighted toward procurement and civil logistics, with lower per-watt engineering overhead due to modular replication patterns.
- Expected ROI: Highly stable, long-term asset yields with predictable IRRs ranging between 7% and 11% across core European markets, depending on localized merchant power curve projections.
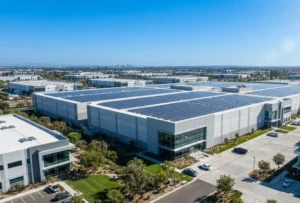
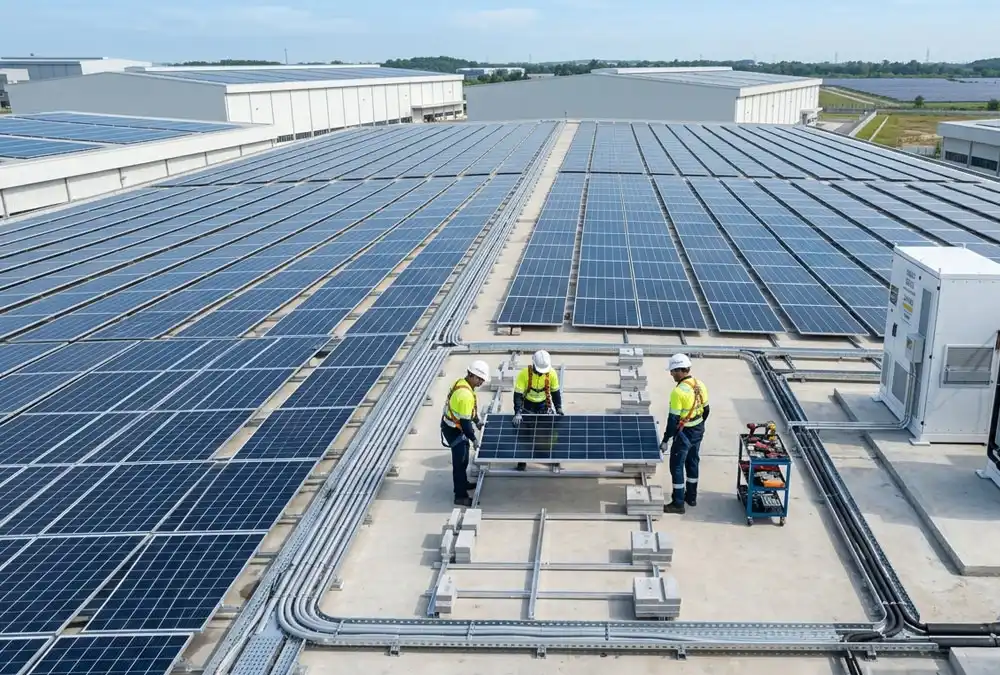
Rooftop Solar EPC Pricing
Rooftop systems present localized, asset-specific engineering parameters that fundamentally differ from open-field configurations, leading to elevated labor and structural anchoring costs.
- Commercial Rooftop Projects: Generally scale from 100 kW to 1 MW. They leverage existing corporate structures to optimize building energy profiles. Costs typically range from €850 to €1,100 per kW due to safety overhead, complex roof-penetration or ballasted constraints, and intricate building electrical tie-ins.
- Industrial Rooftop Projects: Ranging from 1 MW to 5 MW+, these systems optimize large manufacturing or logistics hubs. They achieve favorable economies of scale, driving the industrial solar project cost down toward €720 – €880 per kW.
- Cost Drivers: Structural loading capacity limits (requiring ultra-lightweight mounting or customized panel placements), building height logistics, extensive fire protection compliance (such as rapid shutdown electronics), and localized asbestos remediation or roof reinforcement needs.
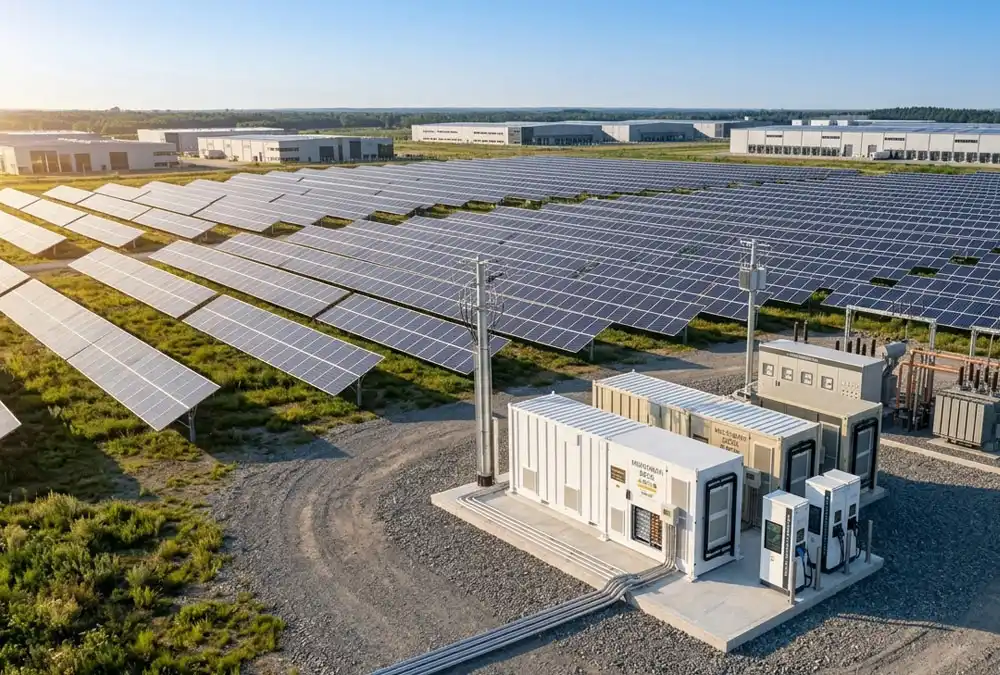
Hybrid Renewable Energy Projects (Solar + Wind + Battery Storage)
The modern European grid demands dispatchability. As a result, static generation assets are rapidly transitioning toward hybrid co-located multi-energy systems. The International Renewable Energy Agency (IRENA) in its report “24/7 renewables: The economics of firm solar and wind” highlighted that firm solar-plus-storage systems achieved highly competitive global levelized costs of €50 – €76 per MWh ($54–$82/MWh) in high-resource regions, proving that hybrid generation is now directly outperforming traditional fossil fuel alternatives.
When modeling a comprehensive solar plus storage EPC cost framework, developers must integrate specific sub-systems into their core financial projections:
- Battery Energy Storage System (BESS): Integrates heavy-duty electrochemical storage cells to buffer intermittency. Lithium Iron Phosphate (LFP) remains the commercial benchmark due to safety and thermal stability, while advanced liquid-cooled architectures prevent localized hot-spots and maximize round-trip efficiency (RTE).
- Energy Management System (EMS): The software brain of the system. It monitors localized load profiles, forecasts generation via weather algorithms, and executes complex algorithmic dispatch strategies for peak shaving and spot market energy arbitrage.
- Power Conversion System (PCS): Bi-directional inverter topologies that manage the dynamic four-quadrant power flow between the solar DC bus, the battery storage bank, and the AC utility grid, executing rapid milli-second responses to frequency fluctuations.
Key Factors Affecting Solar EPC Pricing in Europe
Land Costs and Site Conditions
The physical ground beneath a solar asset controls civil engineering risk. Heavy clearing, rocky topographies requiring specialized drilling rigs instead of standard hydraulic ramming, and complex drainage systems to prevent erosion on sloped terrains add significant premiums to the final Solar Installation Cost.
Solar Panel Selection and System Size
The hardware selection directly impacts active generation footprints. Utilizing high-efficiency n-type TOPCon (Tunnel Oxide Passivated Contact) or Heterojunction (HJT) bifacial modules increases procurement cost per watt by 8% to 12% compared to legacy p-type mono-PERC options, but increases energy harvest by up to 4% to 7% via superior low-light performance and a lower temperature coefficient ($ -0.30\%/^\circ\text{C} $).
Inverter Technology
Developers must choose between central inverter topologies (lower initial CAPEX per watt, centralized maintenance point, best for flat terrain utility scale) and string inverters (higher component cost, multi-MPPT tracking which optimizes uneven terrains or tracking systems, lower single-point-of-failure risk). For hybrid configurations, multi-port hybrid inverters optimize the system architecture by eliminating redundant AC-coupled conversion stages.
Solar Installation Type
Ground-mounted configurations remain the most economical for scale but face high land lease costs. Rooftop systems eliminate land procurement costs but require expensive safety netting and specialized scaffolding. Floating Solar Systems (FPV) mounted on industrial reservoirs or old mining lakes eliminate land constraints and benefit from water-cooling efficiency boosts, but incur a 20% to 35% premium due to specialized corrosion-resistant HDPE pontoons and specialized marine mooring lines.
Mounting Structure Type
Fixed-tilt racking systems minimize mechanical failure risks and represent the lowest upfront cost configuration. Conversely, single-axis trackers follow the sun’s daily trajectory, increasing initial structural costs by €0.03 – €0.05 per watt but lifting overall energy yields by 15% to 25% in high-irradiance Southern European zones, drastically accelerating the Solar Project ROI.
Government Incentives and Renewable Energy Policies
The European Union’s REPowerEU directive has established diverse support mechanisms. From direct capital investment subsidies in Eastern Europe to complex Contracts for Difference (CfD) and feed-in tariffs (FiT) in Western Europe, these mechanisms offset risk and shape structural project engineering requirements.
Civil, Electrical and Structural Engineering Requirements
The distance between the generation field and the grid injection point can make or break a project. Elongated medium-voltage trenching runs through complex public rights-of-way, dedicated substation step-up transformers, and specialized grid-stabilizing capacitor banks directly scale the electrical balance of system costs.
Supply Chain Reliability and Vendor Quality
Sourcing equipment from tier-1 manufacturers reduces long-term operational risks. Extended equipment lead times can stall onsite civil crews, triggering heavy contractual liquidated damages. Selecting financially solvent hardware vendors ensures that 25-year performance warranties remain enforceable through changing economic cycles.
Solar EPC Cost and Project ROI Analysis
How to Calculate Solar EPC Project ROI
To accurately assess a Renewable Energy Investment, developers utilize comprehensive financial modeling that maps Initial CAPEX against lifetime yields:
$$\text{Simple Payback Period} = \frac{\text{Total Capital Expenditure (CAPEX)}}{\text{Annual Net Revenue}}$$
Where CAPEX equals the total Solar EPC Pricing minus localized subsidies, and Annual Net Revenue accounts for total generation multiplied by the PPA rate, minus annual OPEX (Operations, Maintenance, Insurance, and Asset Management).
Typical Payback Period for Solar EPC Projects
- Commercial Solar Projects: 5 to 7 years across Central Europe, highly dependent on internal self-consumption rates. Every kilowatt-hour consumed onsite offsets retail grid power purchases.
- Industrial Solar Projects: 4 to 6 years in high-tariff zones. Energy-intensive manufacturing operations operating daytime shifts maximize direct solar consumption, leading to exceptional capital amortization rates.
- Utility-Scale Solar Farms: 7 to 10 years. These projects operate on tighter wholesale merchant pricing or fixed PPA margins but benefit from long asset lifecycles and highly optimized automated utility management.
Key Financial Metrics Investors Should Track
- Internal Rate of Return (IRR): The annualized metric indicating project profitability. Unleveraged IRRs for standard European solar assets float between 6% and 9%; leveraged configurations frequently exceed 12%.
- Net Present Value (NPV): The current value of all future cash flows discounted at a specific cost of capital. A positive NPV indicates the project clears capital hurdle rates.
- Levelized Cost of Energy (LCOE): The average cost per megawatt-hour generated over the full lifetime of the asset:
$$LCOE = \frac{\sum_{t=0}^{N} \frac{\text{CAPEX}_t + \text{OPEX}_t}{(1+r)^t}}{\sum_{t=1}^{N} \frac{\text{Energy}_t}{(1+r)^t}}$$
Where $r$ represents the discount rate and $\text{Energy}_t$ is the annual power generation adjusted for module degradation.
Solar EPC Cost vs ROI – Industry Benchmark Comparison
Solar EPC Cost Comparison by Project Type
The table below provides a comprehensive operational benchmark comparing core financial metrics across different deployment archetypes within the European market:
| Project Type | Average EPC Cost Range (€/MW) | Typical OPEX (€/MW/Year) | Target LCOE (€/MWh) | ROI / IRR Potential (Leveraged) |
|---|---|---|---|---|
| Rooftop Commercial | €850,000 – €1,100,000 | €15,000 – €22,000 | €65 – €85 | 12% – 16% (Via retail tariff offsetting) |
| Industrial Solar | €720,000 – €880,000 | €12,000 – €18,000 | €55 – €75 | 11% – 15% (High direct self-consumption) |
| Utility Scale Solar | €480,000 – €590,000 | €7,500 – €11,000 | €38 – €50 | 8% – 11% (Wholesale merchant / PPA) |
| Solar + Storage (BESS) | €850,000 – €1,200,000* | €18,000 – €26,000 | €54 – €82 | 10% – 14% (Arbitrage + ancillary services) |
*Note: Solar + Storage cost is highly variable based on the continuous duration capacity (e.g., 2-hour vs. 4-hour battery storage system configurations).
How Solar Plus Storage Impacts ROI
While adding a battery energy storage system EPC cost layer increments the initial capital deployment, it fundamentally alters the revenue generation capability of the asset from a passive generation plant to a dynamic trading node:
- Peak Shaving Benefits: Eradicates extreme consumption spikes during peak industrial operational windows, flattening the load profile drawn from the grid.
- Self-Consumption Optimization: Stores excess mid-day solar power that would otherwise be curtailed or injected at negative wholesale prices, shifting delivery to high-tariff evening hours.
- Demand Charge Reduction: Lowers fixed network capacity reservation costs levied by regional DSOs on industrial energy users.
- Grid Services Revenue: Enables the asset to bid into highly lucrative ancillary services markets, including Frequency Containment Reserves (FCR) and automatic Frequency Restoration Reserves (aFRR).
Benchmarking Against Other Renewable Energy Investments
Compared to onshore wind projects, which carry higher civil engineering and rotating-machinery maintenance risks, solar PV presents a highly predictable, solid-state risk profile with minimal moving parts. When cross-referenced with legacy diesel generation systems common in isolated industrial zones, solar paired with BESS cuts operational fuel cost liabilities entirely, providing a permanent hedge against volatile global commodity corridors.
AnengJi Power’s Perspective on Competitive Solar EPC Pricing
Balancing Cost Competitiveness and Project Reliability
Chasing the absolute lowest initial bid often introduces significant long-term operational risks. Sub-standard electrical connections, lower-grade structural galvanization, and poor engineering shortcuts result in rapid micro-cracking of cells, accelerated thermal degradation, and unexpected inverter dropouts. AnengJi Power focuses on minimizing the Total Cost of Ownership (TCO) by ensuring that initial competitive pricing never compromises the structural or electrical integrity of the generation asset.
Global Procurement Advantages
AnengJi Power leverages its extensive industrial positioning to optimize every layer of equipment acquisition. Through centralized strategic supplier partnerships and massive bulk purchasing frameworks, the company bypasses intermediate distributor markups, passing direct material cost reductions straight to project developers.
Local Supplier Networks and Regional Support
Hardware optimization is coupled with highly responsive local execution. AnengJi Power integrates regional engineering support networks across key European growth centers to ensure swift equipment delivery, reduced inland transport logistics costs, and seamless coordination with municipal grid entities during the critical interconnection phases.
Transparent Solar EPC Cost Structure
Financial predictability is the cornerstone of project bankability. AnengJi Power maintains a strict transparent costing methodology, providing deep itemized visibility across all civil, structural, mechanical, and electrical line items. This open-book approach eliminates hidden modification fees or unexpected post-tender cost adjustments, keeping the project strictly within budget parameters.
Compliance with International Standards
Every system engineered by AnengJi Power aligns with rigid international and European regulatory standards. All equipment carries verified CE compliance markings and meets stringent IEC standards (such as IEC 61215 for module design qualification and IEC 62109 for inverter safety), satisfying the strict technical due diligence requirements of leading European financial institutions.
Turnkey EPC Cost vs Itemized EPC Pricing
What Is Turnkey EPC Pricing?
Under a turnkey single-contract structure, the EPC contractor assumes absolute engineering, logistics, procurement, execution, and commissioning responsibilities under a fixed-price arrangement. The contractor bears the risk of interface management, project delays, and technical mismatches.
What Is Itemized EPC Pricing?
In an itemized or split-contract structure, the project owner acts as the primary developer or hires an independent owner’s engineer. They purchase modules directly from one manufacturer, inverters from another vendor, and contract separate civil and electrical labor providers to perform the installation works.
Turnkey EPC vs Itemized EPC Cost Comparison
| Evaluation Factor | Turnkey EPC Model | Itemized EPC Model |
|---|---|---|
| Cost Transparency | Fixed overall project cost; predefined variation margins. | High component visibility, but highly prone to unexpected field variations. |
| Risk Exposure | Low for owner; risks are legally wrapped by the contractor. | High for owner; interface failures between vendors become owner’s liability. |
| Project Control | Streamlined; owner monitors milestones via a single contact. | High direct control over component selections and individual vendor margins. |
| Delivery Speed | Fast; unified scheduling prevents gaps between execution phases. | Slower; sequencing mismatches between separate contractors cause delays. |
Which EPC Pricing Model Is Best for Your Solar Project?
- Small Projects (<1 MW): Turnkey is highly recommended to minimize complex engineering management costs relative to overall asset value.
- Industrial Projects (1 MW – 10 MW): Turnkey provides the necessary execution security and performance guarantees required by corporate financial boards to clear capital deployment criteria.
- Utility-Scale Projects (50 MW+): Large institutional developers with dedicated in-house technical engineering teams may selectively utilize split-EPC or itemized models to squeeze thin margins out of global procurement, provided they can absorb the heavy execution interface risks.
Solar EPC Tender Cost and Bid Price Trends
Turnkey EPC Contract Cost – Advantages and Disadvantages
While the single point of responsibility minimizes management overhead and enforces comprehensive performance wraps, the upfront turnkey cost may include a risk-premium padding integrated by the contractor to buffer against unpredictable weather, localized permitting delays, or material price fluctuations.
Itemized EPC Pricing Structure
This path unlocks greater localized sourcing flexibility and allows the owner to optimize specific tax or customs exemptions on component classifications. However, it requires significant administrative overhead and exposes the developer to costly legal disputes if the civil contractor blames the electrical installer for project performance degradation.
Solar EPC Bid Price Trends in Europe
Recent tender data across Germany, Spain, and Poland indicates that average bid prices are becoming highly competitive. While steel costs for fixed structures have leveled off, tracking hardware software integration costs have decreased. Grid integration works and high-voltage transformer substations represent the only growing cost segments due to strict manufacturer backlogs for electrical switchgear equipment.
How to Evaluate Solar EPC Tender Proposals
- Technical Evaluation: Look beyond simple equipment data sheets. Analyze structural wind-load designs, calculated electrical cable losses (target below 1.5% total DC+AC drop), and detailed generation simulation assumptions (ensuring realistic weather data sets were utilized).
- Financial Evaluation: Scrutinize the payment milestone structure. Ensure cash outlays track physical construction progress, and retain a 5% to 10% cash retention pool until final commercial operation date (COD) and performance testing verification are successfully cleared.
- Risk Assessment: Evaluate the contractor’s balance sheet strength, liquid asset ratios, and their historical European execution track record. A performance guarantee is only as solid as the entity backing it.
Cost Optimization Strategies with AnengJi Power
Customized Solar EPC Design for Lower Lifecycle Costs
AnengJi Power rejects generic engineering templates. By performing highly specific layout optimizations tailored to the unique terrain, localized wind profiles, and specific shading constraints of each site, we maximize structural efficiency. Our precision engineering ensures maximum string configuration layouts that significantly reduce overall DC cabling requirements and minimize localized combiner box infrastructure.
Customized Component Manufacturing
To directly combat upstream material inflation, AnengJi Power aligns system design with optimized manufacturing output. By matching mounting structures directly to the physical dimensions of advanced high-power bifacial modules, we eliminate excess steel usage and reduce field modification labor requirements, passing direct structural savings directly to our clients.
Future-Proof Energy Solutions
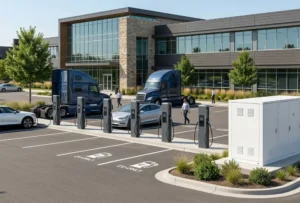
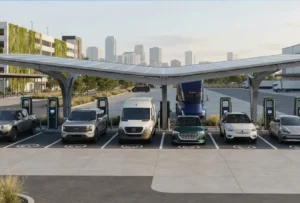
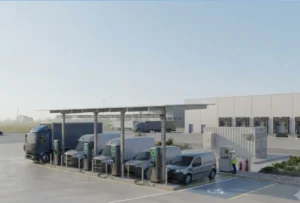
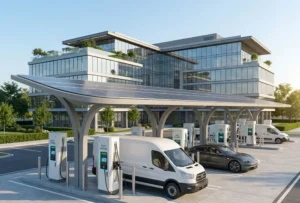
As the European transition deepens, a standalone generation system risks economic obsolescence due to changing grid dynamics. AnengJi Power engineers systems for long-term versatility, ensuring full microgrid readiness. Every design can seamlessly integrate co-located EV charging station with battery storage cost upgrades and smart EMS dispatch overlays without requiring a structural overhaul of the core electrical switchgear.
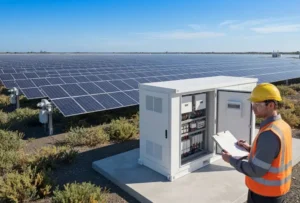
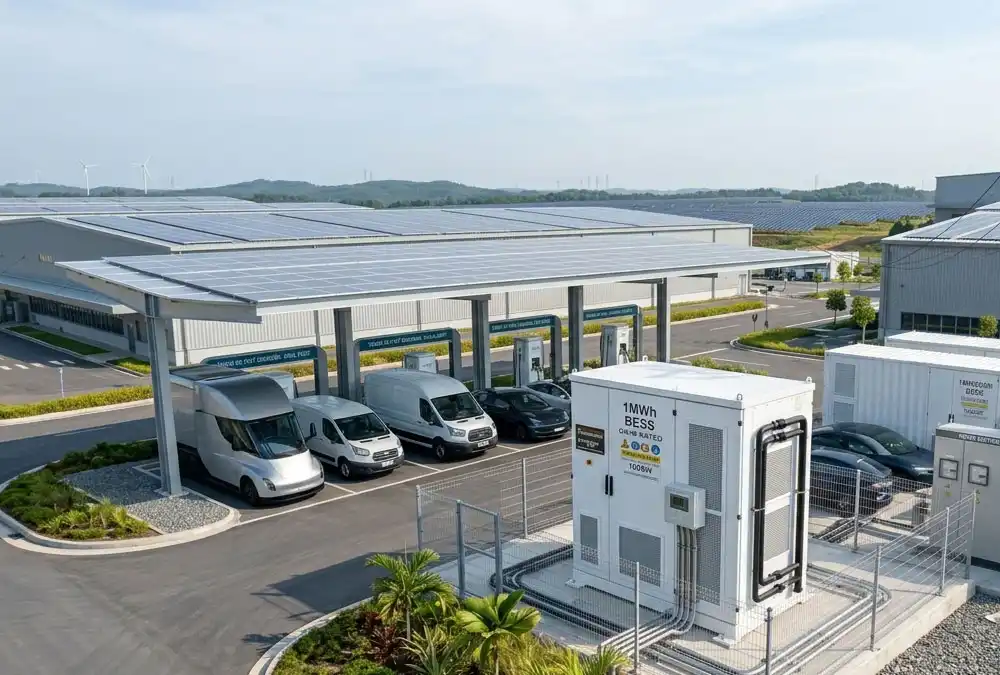
Industrial Storage Product Spotlight: 261kWh Liquid-Cooled C&I BESS
For European industrial facilities aiming to optimize energy economics alongside solar deployment, AnengJi Power recommends the 261kWh All-in-One Liquid-Cooled Commercial & Industrial Battery Energy Storage System. This highly integrated system is specifically designed to meet Europe’s rigorous safety and grid efficiency standards.
- Core Technology & Safety: Utilizes premium Lithium Iron Phosphate (LFP) cells. Unlike traditional air-cooled systems, the features an advanced liquid-cooling system that keeps temperature differentials across all cells within ≤2°C, significantly extending battery cycle life and preventing thermal runaway risks.
- All-in-One Architecture: Integrates the battery cells, a high-efficiency bi-directional Power Conversion System (PCS), an intelligent Energy Management System (EMS), and a certified fire suppression system into a compact, weatherproof outdoor enclosure.
- Alternative Technology Comparison: While alternatives like Flywheel Energy Storage offer high power for short durations, and Redox Flow Batteries provide ultra-long durations for utility-scale projects, LFP-based liquid-cooled systems offer the absolute best commercial balance of energy density, modularity, and rapid response times required for industrial peak shaving and solar self-consumption.
Reducing Total Cost of Ownership (TCO)
Our engineering methodology prioritizes long-term operational resilience. By utilizing high-protection components (such as IP66 electrical enclosures), advanced anti-PID (Potential Induced Degradation) module technology, and automated string-level monitoring, we minimize onsite operational expenditures. The result is an optimized asset that generates higher cumulative yields over its lifetime, driving down the true LCOE and maximizing investor returns.
Frequently Asked Questions About Solar EPC Cost
How much does a solar EPC project cost per MW in Europe?
The average ground-mounted Solar EPC Cost per MW typically ranges from µ€480,000 to €590,000 for utility-scale projects exceeding 50 MW. Mid-scale ground installations and industrial configurations generally range from €640,000 to €880,000 per MW, driven primarily by localized civil conditions, labor rates, and specific grid connection requirements.
What is included in Solar EPC pricing?
Comprehensive EPC pricing covers all detailed engineering phases, site preparation, component procurement (modules, inverters, racking, balance of system), complete mechanical and electrical installation, grid substation construction, utility interconnection testing, and formal final commissioning support.
How does battery storage affect Solar EPC Cost?
Integrating a Battery Energy Storage System (BESS) increases the initial upfront CAPEX, often adding €180,000 to €320,000 per MWh depending on the duration and cooling technology chosen. However, it significantly improves overall asset ROI by unlocking high-value revenue streams through peak shaving, capacity firming, demand charge reduction, and ancillary grid participation.
What factors have the biggest impact on Solar EPC Cost?
The primary cost drivers are upstream solar module and inverter procurement, site-specific civil engineering and terrain preparation challenges, localized manual labor costs, mounting structure configurations (fixed vs. tracking), and the complexity of the utility grid interconnection infrastructure.
Conclusion – Partnering for Cost-Effective Solar EPC Project Execution
Key Takeaways for Solar Project Investors
- Understand the true Solar EPC Cost beyond equipment pricing: Civil works, grid infrastructure, and soft engineering management represent substantial portions of capital deployment.
- Evaluate project-specific cost drivers before budgeting: Geotechnical profiles and grid-code complexities must be analyzed early during feasibility phases.
- Focus on long-term ROI rather than lowest upfront cost: High-tier engineering and quality components safeguard performance, driving down lifetime TCO.
- Compare turnkey and itemized EPC approaches carefully: Balance your team’s internal execution capability against the risk-mitigation benefits of a turnkey contract.
- Consider Solar + Storage solutions for future energy resilience: Co-locating BESS transforms an intermittent generation plant into a highly versatile, dispatchable energy asset.
Why the Right EPC Partner Matters
A successful solar asset is not defined solely by its initial contract price. The optimal engineering partner combines deep technical expertise, robust global supply chain resources, complete pricing transparency, and long-term performance wraps to deliver maximum value, ensuring sustainable financial returns and high-performing asset security over its entire operational lifecycle.