Introduction
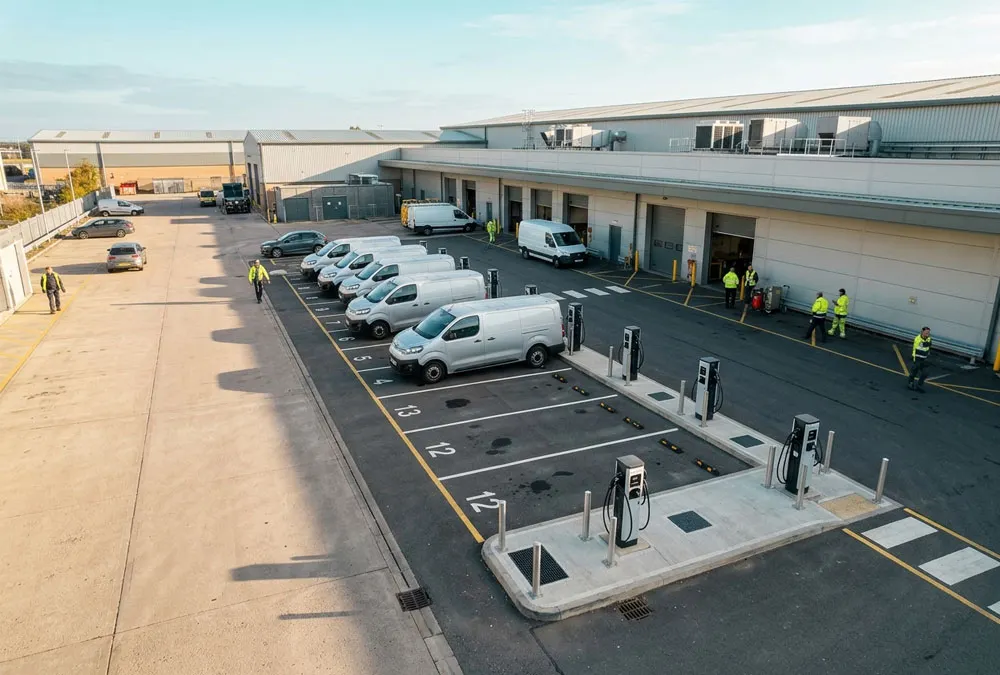
Your supplier proposes twelve 22 kW chargers—a combined nameplate of 264 kW. The site can release only 120 kW without an electrical upgrade. Do you reduce the charger count, accept slower sessions, pay for more capacity, or use EV charger load management?
The right answer is not found by dividing 120 kW equally between twelve sockets. You need to know how many vehicles charge at the same time, how many kilowatt-hours each vehicle needs, when it must leave, which electrical boundary is constrained, and what happens when the meter or control network fails. This guide gives you the calculations, authority data and acceptance questions needed to make that decision before equipment is ordered.
What you should know in the next five minutes
- Whether your problem requires charger power sharing, whole-site dynamic control or an electrical upgrade.
- How to calculate the charging budget that is actually available.
- Why a system can remain below its power ceiling and still leave vehicles undercharged.
- Which questions turn “load balancing included” into a testable procurement requirement.
4 vehicles active
120 kW ÷ 4 = 30 kW each, but a 22 kW charger still caps each vehicle at 22 kW.
6 vehicles active
120 kW ÷ 6 = 20 kW each before vehicle limits and reserve.
12 vehicles active
120 kW ÷ 12 = 10 kW each. Four hours could deliver 40 kWh per vehicle in an idealised calculation.
Illustrative arithmetic only: actual delivery is affected by vehicle acceptance, charging losses, phase limits, interruptions and the configured operating reserve. The example shows why connected-port count alone is not a design method.
What Is EV Charger Load Management?
Load management establishes a controlled charging budget and changes charger output, start time or priority so that EV demand remains within the approved capacity. The boundary may be a grid connection point, transformer, main switchboard, EV distribution panel, feeder, power cabinet or charger group. A proposal that says only “load balancing included” has not yet defined what is protected.
Four terms that should not be treated as interchangeable
- Fixed limit: caps one charger or connector. It is simple, but unused capacity elsewhere is not redistributed.
- Power sharing: divides a fixed EV budget within a group or cabinet. It may not see HVAC, machinery or other building loads.
- Dynamic load management: changes the EV budget using live site measurements. Meter accuracy, communications and fallback become part of the design.
- Hard load shedding: pauses or disconnects a load at a threshold. Restart, authorization and billing continuity must be tested.
Load management cannot create energy. It cannot repair an inadequate parking window, make a vehicle accept more power, or guarantee that a cloud-dependent control path will remain available. Those limitations should be visible before hardware is ordered.
The First Calculation: Can the Site Deliver Enough Energy Before Vehicles Leave?
A useful first control model is:
The calculation must use a defined measurement point. If the meter measures total site import, the controller must know how EV power is represented in that reading. If it measures only non-EV demand, the design must show that the measurement boundary captures every uncontrolled load that can affect the protected asset. Meter location, current-transformer direction and phase assignment belong on the single-line diagram—not in an unwritten commissioning assumption.
Use this four-step feasibility check before comparing controllers:
- Set the protected limit. Record the grid, transformer, panel and per-phase boundaries, then reserve the margin required by the project design.
- Measure the changing non-EV demand. Use representative interval data rather than one convenient off-peak reading.
- Calculate the minimum average charging power. Required energy divided by usable charging hours gives an initial average; early departures must then be checked separately.
- Test the busiest credible day. Include clustered arrivals, short dwell, charger outage, reduced building capacity and priority vehicles.
A quick energy test
If 20 fleet vehicles each require 25 kWh overnight, the site must deliver 500 kWh. Across an eight-hour window, that is 62.5 kW average before losses, reserve, unequal arrivals and outages. A 100 kW site limit may appear sufficient, but the design still fails if several route-critical vehicles arrive late and need most of their energy before 05:00.
The Network Rail Example: 15 Chargers Behind a 500 A-Per-Phase Supply
Section 3.4, Table 3.1 on page 40 of Network Rail’s 2023 EV charging design manual presents a concrete active-load-management example. The site has 15 three-phase chargers rated at 22 kW and 32 A, while the building has 500 A available per phase. The allocation changes with the building load as follows. Review Network Rail’s design manual and Table 3.1.
| Other building load | EV-system budget in the example | Allocation with 15 active chargers | What the buyer should verify |
|---|---|---|---|
| 350 A | 150 A | 10 A per charger | Whether 10 A still delivers enough energy during each parking window |
| 50 A | 450 A | 30 A per charger | How quickly the controller releases and reallocates spare capacity |
| More than 430 A | Charging paused in this design example | No active charging until capacity returns | Automatic restart, session continuity, user message and recovery ramp |
The example demonstrates dynamic allocation, not a universal setting. A factory, hotel or fleet depot needs its own measured demand profile, reserve policy, protection study and operating schedule.
Why Total kW Can Hide a Three-Phase Constraint
On a three-phase site, the total import ceiling and each phase-current limit must be respected. A site may appear to have spare total power while one phase is already constrained by single-phase vehicles or uneven building loads. In gridX’s documented DLM implementation, total and per-phase limits apply together, the most restrictive constraint governs, and AC charger phase mapping is required. Its documentation also shows that integer-ampere commands can make actual power slightly lower than the nominal kW target—for example, a 10 kW target becomes 9.66 kW for a three-phase EV at 14 A. This is a vendor implementation example, not a universal algorithm. See the gridX DLM implementation details.
Static, Dynamic or Priority-Based Load Management?
| Method | Control input | Good starting case | Operational risk | Procurement test |
|---|---|---|---|---|
| Static group limit | Fixed EV budget | Dedicated EV panel with predictable spare capacity | Leaves capacity unused when building demand falls | Connect and disconnect chargers; confirm immediate redistribution |
| Dynamic site limit | Live grid/building measurement | Mixed-use commercial sites with variable HVAC or production load | Meter or communications failure can force a conservative fallback | Step the building load and confirm total and per-phase compliance |
| Priority/deadline allocation | Required kWh, departure time, role or tariff | Fleet vehicles with known duties and unequal operational value | Bad or missing inputs can misallocate power | Run conflicting departures and verify that critical vehicles meet targets |
| Time-based scheduling | Clock, tariff or operating schedule | Stable off-peak windows | Schedules become wrong when shifts or tariffs change | Test daylight-saving, time sync and exception handling |
A fast way to narrow the choice
- Choose a static group limit when the EV panel has a stable, dedicated capacity.
- Investigate dynamic site control when HVAC, kitchens, machinery or other loads move significantly during charging hours.
- Add priority or deadline logic when missed departures have operational cost.
- Use time scheduling only when tariff and operating windows are sufficiently predictable—and define exceptions.
The U.S. Department of Energy describes managed charging objectives that include avoiding demand peaks, enforcing a power ceiling and preserving fleet readiness. Its implementation guidance also calls for vehicle inventory, dwell schedules, utility tariffs, building load and transformer utilisation as design inputs. Although this guidance targets U.S. federal fleets, the decision logic is useful for commercial projects elsewhere. Review the DOE managed-charging objectives and implementation inputs.
A Site Can Stay Below Its Limit and Still Fail Its Drivers
Equal sharing looks fair on a dashboard, but the vehicles may not have equal needs. Consider this illustrative fleet schedule. It is an engineering example, not measured AnengJi project data.
| Vehicle | Energy required | Departure | Risk under equal sharing |
|---|---|---|---|
| Route-critical van A | 45 kWh | 06:00 | May leave short if every vehicle receives the same power |
| Van B | 25 kWh | 07:00 | Needs moderate early allocation |
| Van C | 20 kWh | 09:00 | Can defer part of its session |
| Pool car D | 10 kWh | 12:00 | Has the greatest scheduling flexibility |
The four vehicles need 100 kWh in total, but total energy alone does not prove feasibility. The controller must place enough area under the power-versus-time curve before each departure. Otherwise, the dashboard can show “no overload” while the operations team sees a missed route.
The European smart-charging guide hosted by the European Alternative Fuels Observatory makes the same operational point: simple balancing can be suboptimal because all connected vehicles may be restricted even when one needs to leave earlier. Its load-management section on page 6 also illustrates ten 22 kW charge points operating behind a 50 kW supply. Read the European smart-charging guide.
How the Control Signal Travels from the Main Meter to the Vehicle
Power and control chain
Grid / transformer → main meter or CTs → local controller or EMS → CSMS / protocol path → AC and DC chargers → vehicles
The measurement layer reports the controlled boundary. The controller subtracts uncontrollable demand and reserve, then applies an allocation objective. A communications layer sends a current, power or schedule limit to each controllable charger. The charger applies the limit and returns status and meter data. Logs should let the commissioning team compare the requested command, protocol response, reported setting and measured output.
A commercial buyer should ask where the decision is made. A cloud platform can coordinate many sites, but a local controller may provide faster and more resilient site protection. Some designs combine both. What matters is not the marketing label; it is the documented normal path, fallback path and ownership of each component.
Does OCPP Guarantee Load Management?
No. The Open Charge Alliance states that OCPP supports Smart Charging, including load balancing and charge profiles. Yet its current OCPP 1.6 certification programme keeps Smart Charging as an optional profile. A charger carrying an OCPP label may therefore connect to a backend without implementing the exact control functions your project needs. Check OCPP functions with the protocol owner and review the OCPP 1.6 certification profiles.
For every limit command, retain five pieces of evidence: requested value, protocol response, charger read-back, measured output and business outcome. If the command is accepted but current does not change, the integration is not complete. The existing OCPP commercial charging procurement guide provides a deeper workflow for version, profile and backend testing.
What Happens at 2 a.m. When the Meter Stops Reporting?
Buyers often discover failure behaviour only after commissioning: a meter stops reporting, chargers fall to a very low setting, or a hard power cut leaves a vehicle waiting for someone to reconnect it. These are specification issues, not merely support tickets.
- Charging remains low even after the building becomes quiet.
First check whether the controller is using a conservative static cap, stale meter value or fallback setting. Compare the live site meter, configured ceiling, fallback flag and allocation log before changing the limit. - One phase limits the group while total kW still looks acceptable.
Inspect per-phase current and charger phase assignment. The practical correction may be phase reallocation or verified per-phase control—not a larger total-power setting. - The vehicle does not resume after a load-shedding event.
A hard disconnect may trigger a vehicle restart delay or terminate authorization. Review charger, vehicle and transaction logs, then test controlled pause, recovery ramp and session reconciliation with representative vehicles. - The CSMS reports that an OCPP limit was accepted, but output does not change.
Acceptance of a message is not proof of physical control. Compare the requested command, protocol response, charger read-back and measured current; close the firmware/profile/integration defect before site acceptance. - Every connected vehicle receives some power, yet several leave undercharged.
The system may be protecting the electrical limit while failing the business task. Compare required kWh, dwell windows and departures, then change priorities, operating policy, connector plan or available capacity.
Use the LIMIT–MEASURE–ALLOCATE–FAIL SAFE–VERIFY Framework
1. LIMIT: Define Every Electrical Ceiling
Record the grid connection, transformer, switchboard, feeder, EV panel, cabinet and charger limits. Identify which limits are contractual, protective, thermal or operational. Do not use one aggregate kW value where a per-phase or downstream constraint is more restrictive.
2. MEASURE: Verify the Boundary
Put every meter and CT on the single-line diagram. During commissioning, verify direction, phase mapping, scale, time synchronisation and live values against an independent reference. Define how old data may become before it is treated as stale.
3. ALLOCATE: Match Power to the Charging Task
Choose equal sharing only when equal service matches the operating objective. Fleets may need required-energy and departure priorities. Public or workplace sites may need a minimum useful allocation, queue policy and transparent driver message when power is constrained.
4. FAIL SAFE: Define Offline and Recovery Behaviour
Specify the conservative local limit when the meter, controller, site network, internet or CSMS is unavailable. Define whether active sessions continue, pause or stop; how stored transactions are reconciled; and how output ramps after recovery. “Fails safely” is incomplete unless the safe state and user outcome are written down.
5. VERIFY: Accept the System, Not a Checkbox
Factory and site acceptance testing should create auditable evidence. Step the building load, connect and disconnect vehicles, force meter and communications failures, reboot equipment and run conflicting priorities. Confirm both electrical compliance and energy delivered by departure.
What to Put in an EV Charger Load-Management RFQ
A useful RFQ does not need pages of software language. It needs clear answers to seven questions:
- What is protected? Attach the single-line diagram and state every total and per-phase limit.
- What is measured? Identify the meter or CT model, location, direction, update path and failure detection.
- How is power allocated? Describe equal, proportional, priority or deadline logic, including the minimum useful allocation.
- Which exact equipment combination is supported? Name the charger, firmware, OCPP profile, CSMS, controller and meter—not only the brands.
- What happens when data disappears? Define meter, local-network, cloud and controller failure separately.
- What will continue to cost money? List gateway, licence, SIM, cloud, commissioning, software-update and support charges.
- How will the system be accepted? Attach FAT/SAT scripts, required logs, thresholds and the defect-closure process.
Useful acceptance KPIs include boundary-limit exceedances, percentage of priority vehicles receiving required kWh by departure, command/read-back success, fallback activation time, recovery time, time below the project’s minimum useful allocation and per-phase utilisation. Pass values should be project-specific rather than copied from a generic article.
Where AnengJi Charger Options Fit
The hardware schedule should follow the control design. AnengJi publishes AC wallbox and commercial DC options that can be used as initial power-class references. The table below reproduces published electrical data checked on 4 November 2026; it is not a quotation or confirmation that every model supports the same load-management method, OCPP Smart Charging profile, meter or third-party backend.
| Published option | Published electrical data | Potential planning role | Load-management evidence still required |
|---|---|---|---|
| Q6-EH07S4 AC wallbox | 7 kW, 230 V, single-phase, 32 A | Long-dwell bays and mixed single-phase groups | Control interface, group size, meter, fallback and destination-market configuration |
| Q6-EH11S4 AC wallbox | 11 kW, 400 V, three-phase, 16 A | European workplace, hotel or overnight fleet parking | Per-phase allocation, vehicle AC acceptance and exact firmware/software scope |
| Q6-EH22S4 AC wallbox | 22 kW, 400 V, three-phase, 32 A | Long-dwell sites where vehicles can use higher three-phase AC power | Vehicle acceptance, phase capacity and simultaneous-group behaviour |
| Commercial DC family | Published 60/80/120/160 kW options; 380 VAC ±15%; 200–(750)1000 VDC; Ethernet/4G | Priority vehicles, shorter dwell or mixed AC/DC sites | Exact model input, connector allocation, site controller, command path and reduced-limit operation |
For wider shortlisting, review the commercial AC charging range and DC charging options. Ask AnengJi to identify the exact order code, firmware, connector configuration, implemented OCPP functions, controller/meter topology and destination-market evidence in writing.
Information needed for a useful configuration review
- Country, grid/service voltage and single-line diagram
- Transformer, switchboard and per-phase capacity
- Interval building load and planned operating reserve
- Vehicle list, required kWh, arrival, departure and priority
- Proposed AC/DC charger mix, CSMS/EMS and connectivity
- Normal, offline, fallback and recovery requirements
EV Charger Load Management FAQ
Do all commercial EV chargers support load management?
No. Some support only a fixed current limit, some share a fixed budget within a group, and some accept dynamic limits from a local controller or CSMS. Confirm the exact charger, firmware, control interface and tested system combination.
Can load management avoid an electrical upgrade?
Sometimes, but not automatically. It can reduce coincident demand and use spare capacity more effectively. An upgrade may still be required if the daily energy, departure deadlines, per-phase constraints, protection or future expansion cannot be served within the existing infrastructure.
What is the difference between load balancing and dynamic load management?
Load balancing often describes distribution within a fixed charger-group budget. Dynamic load management normally changes that budget using live site measurements. Because suppliers use the terms differently, request a topology and functional description instead of relying on the label.
Can AC and DC chargers share one site limit?
They can in a properly engineered control architecture that can measure the shared boundary and command the selected AC and DC equipment. Mixed-system response time, minimum power, cabinet sharing, vehicle requirements and fallback behaviour must be validated.
What happens if the load-management meter or internet connection fails?
The answer is system-specific. A credible design defines a conservative local limit or another approved safe state, tells operators and users what happens to active sessions, records the event, and verifies controlled recovery. Do not assume cloud loss and meter loss have the same fallback.
How should a fleet prioritise vehicles?
Start with required kWh, departure deadline, vehicle charging limit and operational consequence of a missed departure. Use those inputs to create priority rules, then test them against the busiest credible schedule and charger-outage scenarios.
Plan the Control System Before Buying More Charger Power
A successful EV charger load management project is not the one with the most elaborate dashboard. It is the system that respects every electrical boundary, uses available power productively, survives foreseeable failures and delivers the required energy to the right vehicles on time.
Define the limits, measurement boundary and operating objective before selecting the controller or charger. Then make fallback and acceptance evidence part of the purchase order. That turns “dynamic load management included” from a quotation checkbox into a verifiable commercial charging system.