AC vs DC EV Charging for Business: How to Choose the Right Mix
Europe’s charging network already shows why AC vs DC EV charging is a portfolio decision rather than a winner-takes-all contest. The International Council on Clean Transportation’s European Car Market Monitor: June 2026 reported about 1.20 million public charging points in Europe at the end of Q2 2026: approximately 79% supplied AC and 21% supplied DC. Yet the average rated power of the network had doubled from 25 kW in January 2021 to 51 kW in June 2026. The pattern is revealing—AC still provides most charging-point coverage, while DC adds increasing power and turnover capacity.
That 79:21 network split is observed market data, not a recommended ratio for an individual project. Two 60-space car parks can still need opposite designs. An office where vehicles remain parked for eight hours may use broad AC coverage and one DC recovery charger; a roadside site with the same space count may need several DC fast chargers because each bay must serve multiple vehicles per day. The expensive mistake is choosing by site size or maximum power alone. This guide compares AC-first, balanced and DC-first designs, calculates five-year cost, and tests when extra DC investment is commercially justified.
The practical answer
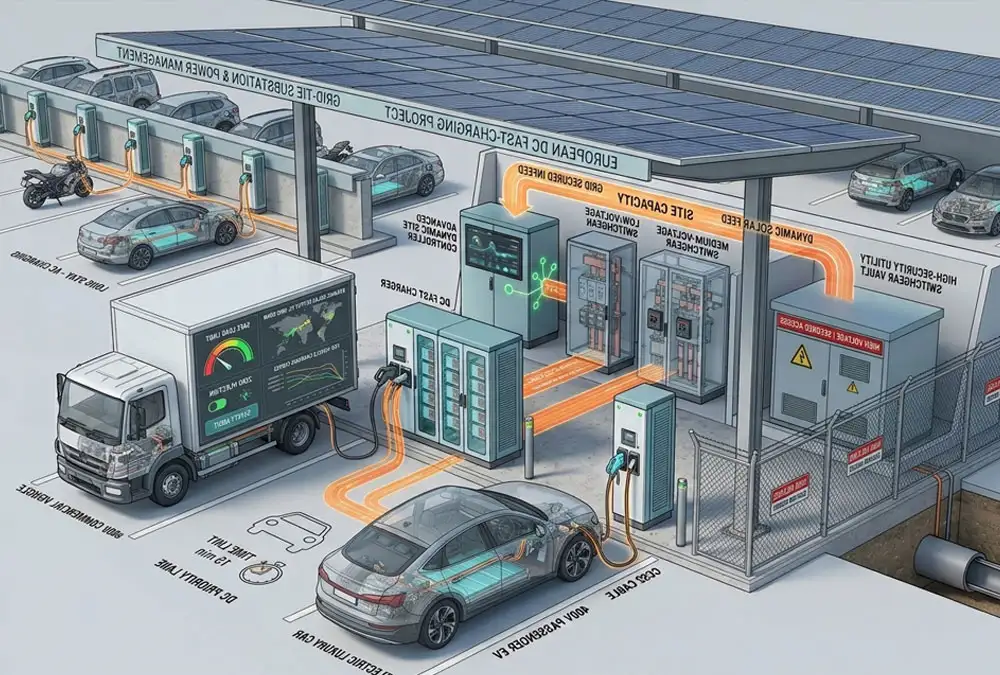
Use AC as the coverage layer for vehicles that remain parked. Use DC as the turnover or recovery layer for vehicles that must leave quickly. Coordinate both under a controlled site-power limit. Do not choose a fixed AC/DC percentage until you know the parking window, required energy, simultaneous demand and departure risk.
Which AC/DC Combination Fits Your Site?
The table below gives starting architectures, not universal designs. “Small,” “medium” and “large” refer to parking and operating scale; they do not replace a load study. A 20-bay taxi depot can require more power than a 150-space office car park.
| Illustrative site | Operating pattern | Starting AC/DC architecture | Why it works | What could change it |
|---|---|---|---|---|
| Small office or hotel 20–40 spaces | Most vehicles stay 4–10 hours | 8–20 managed AC ports; optional 1 × 30–60 kW DC recovery point | More drivers can plug in while time supplies the required energy | Short guest stays, public charging demand or frequently used pool vehicles |
| Medium mixed-use car park 50–120 spaces | Employees, visitors and public users have different dwell times | 20–50 managed AC ports plus 1–3 DC points selected for the turnover group | AC provides coverage; DC creates a premium or urgent service | Traffic volume, paid charging demand and available grid capacity |
| Fleet depot 20–100 vehicles | Scheduled return and departure; route energy varies | AC or lower-power charging for routine overnight tasks; DC for late returns and priority vehicles | Power is assigned by departure priority instead of equally to every vehicle | Multiple shifts, heavy route energy or the cost of a missed departure |
| Large destination site 100+ spaces | Large number of long-stay users with a smaller short-stay segment | Phased AC rollout plus a dedicated DC zone and shared power control | Separating user groups avoids making every space high power | Events, seasonal peaks, public-access obligations and queue behaviour |
| Highway or quick-stop hub | Short dwell and high vehicle throughput | DC-first; AC limited to staff or adjacent long-stay uses | Revenue and customer value depend on vehicles leaving quickly | Grid constraints, vehicle charging curves and poor expected utilisation |
Important: these quantities are illustrative screening ranges. Final port counts and power ratings require vehicle data, a site electrical assessment, local approvals and an operating model.
AC vs DC Charging: The Difference That Changes the Budget
An EV battery stores direct current. With AC charging, the vehicle’s onboard charger converts grid AC into DC; that onboard charger can limit the delivered power. With DC charging, larger conversion hardware sits in the charging station and supplies controlled DC power to the vehicle battery system. The DC architecture supports faster energy transfer, but it also adds power electronics, cooling, installation complexity and higher instantaneous site demand.
| Buyer question | AC charging | DC charging | Commercial consequence |
|---|---|---|---|
| Where is power converted? | Inside the vehicle | Inside the station | AC is constrained by the onboard charger; DC equipment carries more conversion cost. |
| What is being purchased? | Long-dwell access across more bays | Time, throughput and departure assurance | DC only pays when faster service has measurable value. |
| What sets actual power? | EVSE setting, onboard charger, phase supply and site allocation | Charger, vehicle acceptance curve, battery condition and site allocation | Nameplate power is not guaranteed delivered power. |
| What creates cost risk? | Too many uncontrolled ports or unused high-rated AC capacity | Grid upgrade, low utilisation, higher maintenance and downtime exposure | Compare the complete site, not charger purchase price alone. |
The U.S. Department of Energy’s Alternative Fuels Data Center notes that DC charging power varies with the vehicle and battery state of charge in its Electric Vehicle Charging Stations guidance. Therefore, a 150 kW charger does not guarantee 150 kW at the connector throughout a session. Procurement models must keep charger rating, vehicle acceptance and available site power as separate constraints.
Use PACE to Calculate the Required Charging Layer
The PACE model converts vehicle operations into an initial power requirement before equipment is selected.
P — Parking window
How many usable hours exist between connection and departure?
A — Added energy
How many kWh must be delivered before the next trip—not how large is the battery?
C — Concurrency
How many vehicles require energy during the same time interval?
E — Exit certainty
What is the operational or financial cost of an undercharged departure?
First-pass calculation
Minimum average power per vehicle (kW) = required energy before departure (kWh) ÷ usable charging window (hours)
Add allowances for charging losses, temperature, schedule uncertainty and operational reserve. Then check the vehicle’s AC/DC limits and the charger’s power-sharing behaviour.
For example, a vehicle needing 24 kWh during an eight-hour stay has a first-pass average requirement of 3 kW. Installing DC for that routine task is difficult to justify unless the parking window frequently collapses. A vehicle needing 60 kWh in 45 minutes has a first-pass average of 80 kW before allowances and charging-curve effects; that task belongs in the DC layer.
A 60-Space Site: Three AC/DC Charging Options Compared
The following engineering example makes the choice visible. It is not a finished electrical design. Assume a European mixed-use site with 60 parking spaces, up to 30 charging users, about 600 kWh of daily energy demand, mostly four-to-eight-hour stays, and a smaller group requiring faster service. The property can consider different grid allocations, but higher capacity may increase connection and tariff cost.
| Design option | Equipment | Total nameplate | Illustrative controlled site limit | Strength | Trade-off |
|---|---|---|---|---|---|
| A — AC coverage | 24 × 11 kW AC | 264 kW | 132 kW | Maximum plug-in coverage at the lowest example cost | No rapid recovery path for short-stay or late-arriving vehicles |
| B — Balanced mix | 20 × 11 kW AC + 1 × 60 kW DC | 280 kW | 180 kW | Broad coverage plus one priority/paid fast-charging lane | The DC asset must generate operational value to cover its incremental cost |
| C — DC turnover | 12 × 11 kW AC + 2 × 120 kW DC | 372 kW | 300 kW | Higher short-stay throughput and DC redundancy | Highest grid, capital and utilisation risk |
The nameplate total is deliberately different from the controlled site limit. Dynamic load management can reduce coincident demand and prioritise the DC lane or vehicles with imminent departures. It cannot create missing energy: the schedule must still prove that 600 kWh can be delivered during the actual parking windows, with allowance for losses and outages.
How to Compare Initial Cost and Five-Year TCO
Charger price is only one line in the budget. The U.S. Department of Energy’s Procurement and Installation guidance separates equipment, installation, operation, maintenance, electricity, demand charges and network fees. Its published U.S. figures also show why DC projects require wider ranges: site preparation, trenching and electrical upgrades can materially change installed cost. The same cost logic applies in Europe, but U.S. dollar ranges should not be copied into a European budget.
Cost structure
Initial project cost = chargers + transformer/switchgear + protection/cabling + civil works + design/permitting + backend/payment integration + commissioning
Five-year TCO = initial project cost + software/connectivity + maintenance/spares + capacity or demand charges + energy cost + downtime cost − incentives − residual value
Illustrative Budget Assumptions
The following euro values are transparent engineering assumptions created only to demonstrate the calculation. They are not ANENGJI prices, supplier quotations or European market averages. Replace every value with local tenders, utility terms and tax treatment before investment approval.
| Example input | Assumption | Included scope |
|---|---|---|
| 11 kW AC port | €3,500 each | Equipment and local port installation; shared upstream works excluded |
| 60 kW DC point | €55,000 | Equipment and local installation; shared upstream works excluded |
| 120 kW DC point | €95,000 each | Equipment and local installation; shared upstream works excluded |
| Capacity-related tariff placeholder | €8/kW/month | Sensitivity input only; actual tariff structures vary by country and utility |
| Analysis period | 5 years | No discount rate, tax, financing, incentives, energy cost or residual value |
Five-Year Fixed-Cost Comparison
| Cost item | A — AC coverage | B — Balanced mix | C — DC turnover |
|---|---|---|---|
| Charger equipment and local installation | €84,000 | €125,000 | €232,000 |
| Shared electrical and civil works assumption | €35,000 | €50,000 | €90,000 |
| Backend, design and commissioning assumption | €8,000 | €10,000 | €15,000 |
| Illustrative initial project cost | €127,000 | €185,000 | €337,000 |
| Five-year software, service and maintenance assumption | €45,000 | €70,000 | €115,000 |
| Five-year capacity-charge sensitivity | €63,360 | €86,400 | €144,000 |
| Illustrative five-year fixed TCO, excluding energy | €235,360 | €341,400 | €596,000 |
Energy purchases are excluded because the example assumes that each option delivers the same 600 kWh/day. In practice, losses, tariffs and utilisation would differ. Land, financing, tax, payment transaction fees, grants, depreciation, vehicle downtime and residual value are also excluded. The purpose is to compare architecture, not predict a real project price.
When Does the Added DC Investment Break Even?
In the example, Option B costs about €106,040 more than Option A over five years, or approximately €21,208 per year. If each additional DC kilowatt-hour contributes €0.20 after electricity, payment and variable operating cost, the DC lane must create roughly 106,040 additional paid kWh per year—about 291 kWh per day—to cover that difference.
Break-even test
Required additional annual DC energy = annualised incremental TCO ÷ contribution per additional DC kWh
For a fleet, replace charging margin with avoided operational cost: substitute the value of prevented missed departures, avoided public charging, reduced vehicle idle time or a smaller vehicle reserve. If those benefits cannot be measured and utilisation is uncertain, the project should phase DC capacity rather than install the forecast maximum immediately.
Do not compare only electricity selling prices. The ICCT’s 2026 European transition review reported different average EU ad hoc rates for public AC and DC charging, illustrating that faster service can command a different price. However, selling price is not contribution margin; energy purchase, VAT, roaming, payment, maintenance, rent and utilisation still determine the result. See the ICCT’s EV Transition Check 2026, Figure 16 for the scope and observation date.
How Load Management Changes the AC/DC Equation
A charging management system can limit total demand, schedule long-dwell AC charging and reserve power for a DC priority session. This can defer or reduce electrical upgrades when vehicle schedules provide enough flexibility. It does not remove the need for adequate energy and capacity. A 150 kW site limit can supply at most 1,200 kWh over eight hours before losses; software cannot serve a higher energy requirement without more time, more capacity or a different operating plan.
When specifying backend communication, record the exact OCPP version, functional profiles, cybersecurity requirements and target charging-station management system. The Open Charge Alliance protocol overview explains that OCPP standardises communication between charging stations and central systems. A supplier statement that a product “supports OCPP” is still not evidence that every required function has been validated with the buyer’s backend.
Europe vs the United States: Do Not Copy the Same Specification
European Procurement
European buyers normally specify AC and DC power directly. The European Alternative Fuels Observatory’s Recharging Systems classification identifies AC and DC power categories and describes Type 2 for European AC charging and CCS/Combo 2 for DC high-power charging. Confirm the exact country, supply arrangement, metering, accessibility and approval requirements; EU-level guidance does not erase national or local rules.
For publicly accessible charging points in the EU, payment belongs in the equipment and backend specification. Article 5 of Regulation (EU) 2023/1804 sets ad hoc charging and payment requirements with conditions linked to power and deployment date. Do not apply the same requirement automatically to a private workplace or to the United Kingdom.
United States Procurement
U.S. projects commonly compare Level 2 with DC fast charging and must evaluate J1772, CCS1 and J3400/NACS against the target vehicle population and network strategy. Utility demand charges, 208/240/480 V service, permitting and interconnection can materially affect the design. DOE also warns that charging projects include variable “soft costs” such as permitting, siting, interconnection and energisation; its soft-cost guidance explains why these processes can change budgets and schedules.
What Information Should a Commercial Buyer Send in an RFQ?
- Site: country, access model, parking spaces, traffic flow, indoor/outdoor environment and rollout date.
- Vehicles: models or classes, number, connector, onboard AC limit, DC acceptance and future fleet plan.
- PACE data: required kWh, arrival/departure windows, simultaneous demand and departure priority.
- Electrical boundary: supply voltage, available capacity, transformer/switchgear information and expansion options.
- Operations: public/private access, tariff, payment, OCPP/CSMS, RFID/app, reporting and remote diagnostics.
- Commercial boundary: hardware, civil and electrical works, commissioning, software fees, spares, warranty and service response.
- Evidence: model-specific data sheets, declarations, test reports and certification scope for the destination market.
Request at least three priced alternatives: AC-first, balanced and DC-first. Require each supplier to state the controlled maximum demand, simultaneous output assumptions, excluded works and five-year recurring charges. Without a common boundary, the lowest quotation may simply omit the transformer, payment terminal, backend license or commissioning included elsewhere.
How ANENGJI Can Support an AC/DC Charging Project
ANENGJI provides product categories for both layers of a commercial charging design. Buyers can review AC charging station options for long-dwell coverage and commercial DC fast chargers for priority, fleet and public charging applications. Exact power, connector, protocol, certification and payment requirements should be confirmed for the selected model and destination market.
A useful project discussion should begin with the PACE data and the available site-power limit, not only a requested charger quantity. ANENGJI can then evaluate the equipment configuration, load-management requirement, OCPP/CSMS interface, regional connector, OEM/ODM scope and rollout stages against the project brief.
Request three comparable charging configurations
Send your country, vehicle mix, daily kWh, parking windows, concurrency, available power, connector and backend requirements. Ask for an AC-first, balanced and DC-first option with a clear scope boundary.
AC vs DC EV Charging FAQ
Is DC charging always the better commercial investment?
No. DC creates value when time, throughput or departure assurance has measurable financial importance. Long-stay sites can often serve more users per unit of available power through managed AC charging.
Can car-park size determine the AC/DC ratio?
No. Space count is only a planning input. A credible ratio also needs dwell time, required kWh, concurrency, vehicle acceptance, public or private access, grid capacity and the cost of making vehicles wait.
Will every EV take 22 kW from a 22 kW AC charger?
No. The vehicle’s onboard charger, phase capability, EVSE setting and available site power can reduce actual delivery. Use the target vehicle list when specifying AC power.
Should energy storage be added to avoid a grid upgrade?
Only after modelling the load profile, charging objective, usable storage energy, charge source, cycling, losses, tariff and grid conditions. Storage can reshape peak demand, but it does not automatically remove the need for adequate grid capacity.
What is the most useful cost metric?
Use several metrics together: initial cost, five-year TCO, cost per active port, cost per delivered kWh and cost per successfully completed charging task. A fleet should also value avoided missed departures; a public operator should test contribution margin and utilisation.
Choose the Charging Task Before the Charger
A good commercial charging design is not the configuration with the largest nameplate total. It is the lowest-cost system that reliably delivers the required energy before departure, protects critical vehicles, stays within an acceptable site-power limit and can expand without replacing the original architecture.
Use PACE to define the task, compare AC-first, balanced and DC-first options on the same scope, and test the extra DC investment against actual throughput or avoided operational loss. That makes AC vs DC EV charging a measurable procurement decision rather than a generic speed comparison.