Introduction
A 160 kW charger does not guarantee that every vehicle will receive 160 kW. A 350 kW label does not promise a 350 kW session. For EPC teams, charging operators and site owners, the practical question behind charging speed vs charging power is simple: how much energy will each vehicle receive before it must leave?
This guide answers that question with calculations, comparison tables and a diagnostic workflow. Every figure is identified as sourced data, theoretical arithmetic or an illustrative planning assumption.
Power
kW
The instantaneous rate of energy transfer.
Energy
kWh
The amount transferred during a period.
Ideal time
kWh ÷ kW
A theoretical minimum when power is constant.
Real power
Lowest limit
Charger, vehicle, site or voltage/current.
Charging Speed vs Charging Power in 60 Seconds
| Measure | Unit | Plain-language meaning | Professional use |
|---|---|---|---|
| Rated charging power | kW | The charger’s stated maximum capability. | Equipment classification; not a guaranteed session average. |
| Delivered power | kW | What the charger is supplying now. | Session diagnosis and performance testing. |
| Energy delivered | kWh | How much electricity moved during the session. | Billing, fleet energy and departure readiness. |
| Charging speed | kWh/min, %/min or minutes to target SOC | How quickly the vehicle reaches the required battery level. | Operational outcome for the driver or fleet. |
Simple rule: power is the rate; energy is the quantity; charging speed is the result. “Kilometres added per hour” can help a driver, but it is weak procurement data because two vehicles can travel different distances using the same kWh.
How Long Would 50 kWh Take at Different Power Levels?
The table below uses time = 50 kWh ÷ rated kW. It assumes constant full power and no losses, tapering, interruptions or power sharing. It is therefore a theoretical comparison—not a promised charging time.
Ideal time to deliver 50 kWh
7 kW
7 h 09 min
11 kW
4 h 33 min
22 kW
2 h 16 min
60 kW
50 min
80 kW
37.5 min
120 kW
25 min
160 kW
18.75 min
Calculation only: constant rated power, identical 50 kWh energy boundary, no losses or taper.
| Rated power | Ideal time for 50 kWh | Typical project context | Critical check |
|---|---|---|---|
| 7 kW AC | 7 h 09 min | Overnight or long-dwell parking | Vehicle onboard charger and single-phase supply |
| 11 kW AC | 4 h 33 min | Hotel, workplace or fleet dwell | Three-phase vehicle acceptance |
| 22 kW AC | 2 h 16 min | Higher-power destination charging | Many vehicles accept less than 22 kW AC |
| 60 kW DC | 50 min | Retail, mixed fleet or recovery charging | Vehicle curve and site allocation |
| 80 kW DC | 37 min 30 sec | Medium-turnover commercial sites | Output envelope at vehicle voltage |
| 120 kW DC | 25 min | Fast-turnover fleet or public charging | Average power may be far below 120 kW |
| 160 kW DC | 18 min 45 sec | High-turnover charging | Vehicle, cable current and grid limit |
Why the real time is usually longer: the vehicle may accept less power, power normally changes with SOC, the battery may be cold, a second connector may share the cabinet, or the site controller may reduce output.
The AC power classes in this calculation correspond to AnengJi’s verified 7, 11 and 22 kW wallbox range. The DC classes correspond to the listed 60, 80, 120 and 160 kW commercial options. The calculations do not represent product test results.
The Four Numbers That Set Real Charging Power
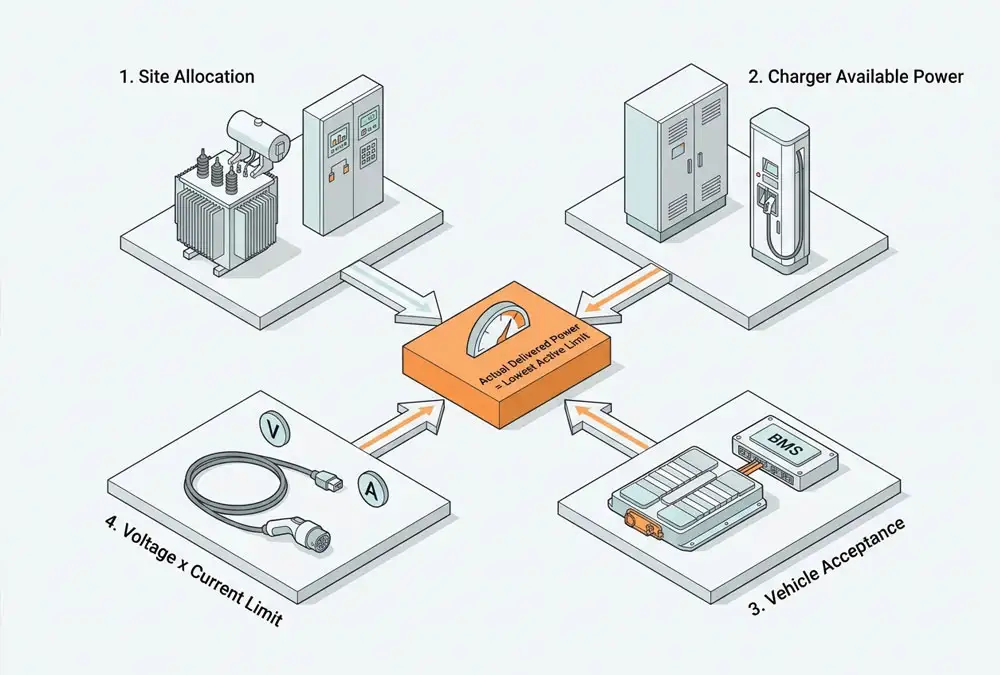
Delivered power is controlled by the lowest active limit:
Real power ≤ minimum of charger, vehicle, site allocation and voltage × current
| Illustrative case | Charger | Vehicle | Site | Voltage/current limit | Maximum possible now |
|---|---|---|---|---|---|
| Vehicle-limited | 160 kW | 100 kW | 160 kW | 160 kW | 100 kW |
| Site-limited | 160 kW | 180 kW | 80 kW | 160 kW | 80 kW |
| Current-limited at 400 V | 160 kW | 180 kW | 160 kW | 400 V × 200 A = 80 kW | 80 kW |
| Full theoretical output | 160 kW | 180 kW | 160 kW | 800 V × 200 A = 160 kW | 160 kW |
All four rows are theoretical examples. They show why professional buyers request the complete voltage–current output envelope. A “160 kW” cabinet may require a high enough battery voltage to reach its full power within a given current limit.
IONITY’s European charging FAQ provides a real-world version of the vehicle-limited case: a vehicle capped at 100 kW cannot exceed 100 kW on a 350 kW station. The same guidance identifies battery temperature and SOC as additional limits. See IONITY’s “Charging speed too slow?” FAQ.
What Third-Party Sources Actually Establish
The sources below play different roles. A government reference range is not a product test, and a network operator’s troubleshooting FAQ is not a universal vehicle curve. Separating those roles prevents authority links from being used as decoration.
| Source | Verified content | Scope | How the buyer should use it |
|---|---|---|---|
| BEAMA/GFI infrastructure guide, Section 3.4 | Time = required kWh ÷ kW; actual output also depends on network capacity, battery, SOC, temperature, onboard charger, cable and chargepoint | UK infrastructure guidance, September 2024 | Build a complete input list instead of applying the simple time formula alone |
| IONITY charging-speed FAQ | Vehicle maximum, SOC and battery temperature can limit a high-power session | European network operator guidance | Diagnose the vehicle and session conditions before declaring a charger fault |
| TomTom EV Routing documentation | Charging time requires a state-dependent power curve; measured vehicle curves are preferred | Routing and charging-time modelling | Request a curve or session log, not a single peak number |
| US DOT charger types and speeds | Broad Level 1, Level 2 and DCFC time ranges and selection factors | United States light-duty charging reference | Use the ranges for context, not as European equipment guarantees |
Why Peak Power Does Not Equal Average Charging Speed
Assume a hypothetical 30-minute session follows the simplified profile below:
| Interval | Average power in interval | Energy delivered | What the driver sees |
|---|---|---|---|
| 0–10 min | 150 kW | 25.0 kWh | High initial power |
| 10–20 min | 100 kW | 16.7 kWh | Power starts tapering |
| 20–30 min | 50 kW | 8.3 kWh | Lower ending power |
| Total | 100 kW session average | 50.0 kWh | 150 kW peak, but not sustained |
The session reached 150 kW, yet the average was 100 kW. Quoting only the peak would overstate the energy transferred during the half hour by 50%. Commercial comparisons should therefore include energy in 15 or 30 minutes, average power over a stated SOC window and time to the project’s target SOC.
What a Charging Curve Looks Like in Numbers
TomTom’s EV Routing documentation provides a generic fallback curve for modelling when a measured vehicle curve is unavailable. It is not a promise for any particular vehicle. The values below express power as a percentage of that vehicle’s peak.
Generic power curve used as a modelling fallback
Power rises from 35 percent of peak at zero state of charge to 100 percent between 10 and 35 percent, then falls to 5 percent at full charge.
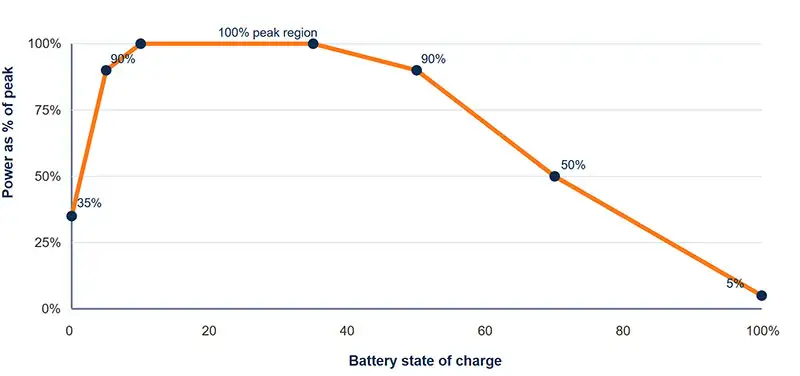
Source: TomTom EV Routing generic fallback curve. It assumes a preconditioned battery and should be replaced with measured vehicle data where available.
| Battery state | Generic power level | Visual | Interpretation |
|---|---|---|---|
| 0% | 35% of peak | Very low SOC does not always mean immediate peak power | |
| 5% | 90% | Power rises quickly in the model | |
| 10–35% | 100% | Peak region | |
| 50% | 90% | Taper begins | |
| 70% | 50% | Only half the peak in this generic model | |
| 100% | 5% | Very low finishing power |
TomTom recommends measured curves for accurate time prediction because vehicles differ materially. The source and its modelling assumptions are available in the charging-curve documentation.
Three Site Calculations That Produce Different Designs
These examples are planning assumptions, not final equipment recommendations. They show why the same daily kWh can require different connector power.
| Illustrative site | Energy requirement | Usable window | Ideal average battery-side power | What actually drives the design |
|---|---|---|---|---|
| Hotel | 20 cars × 15 kWh = 300 kWh | 10 hours | 30 kW | Connector coverage, overnight occupancy and fair load sharing |
| Workplace | 12 cars × 12 kWh = 144 kWh | 8 hours | 18 kW | Arrival concentration, parked-but-not-charging time and access rules |
| Fleet depot | 10 vans × 30 kWh = 300 kWh | 5 hours | 60 kW | Individual departure deadlines, late returns and redundancy |
Average power is only the first filter. Add losses, auxiliaries, operational reserve and the actual arrival/departure schedule before selecting equipment. A 30 kW hotel average might still need many AC connectors. A 60 kW fleet average might need a higher-power DC charger because several vehicles return late and have short windows.
For the wider AC/DC configuration decision, use the commercial AC and DC mix guide. For transformer, connection and simultaneous demand, see the fast-charging power requirements guide.
A Five-Step Check When Charging Looks Too Slow
| Step | Question | Data to collect | Likely action |
|---|---|---|---|
| 1 | Is SOC already high? | Arrival SOC and power-versus-time trace | Compare the correct SOC window |
| 2 | Is the battery too cold or hot? | Ambient conditions, driving history and preconditioning status | Use supported preconditioning; retest under comparable conditions |
| 3 | Is the vehicle the limit? | Vehicle DC/AC maximum and measured curve | Do not pay for unused charger power without another site benefit |
| 4 | Is power being shared? | Other active connectors and allocation log | Verify the cabinet and site sharing configuration |
| 5 | Is one connector consistently worse? | Connector alarms, temperatures and controlled A/B session | Isolate and inspect under the maintenance procedure |
Do not replace equipment based on one dashboard screenshot. Record the entire session and compare like with like: same vehicle, similar arrival SOC, similar battery condition and the same number of active connectors.

The Measurement Boundary Can Change the Result
| Measurement point | What it includes | Appropriate use | Comparison risk |
|---|---|---|---|
| AC input to charger | Conversion and charger auxiliary consumption | Site load and energy purchase | Not equal to battery energy |
| DC output from charger | Energy leaving the charger at the DC side | Charger-output testing | Still not necessarily the battery’s stored-energy increase |
| Vehicle battery estimate | Vehicle-reported or modelled battery energy | Operational range and SOC planning | Method may differ by vehicle |
A professional efficiency or average-power claim must name its measurement boundary. Otherwise, two correct numbers can appear to conflict simply because they were measured at different points.
Official Reference Ranges Show Why One Time Figure Is Misleading
The US Department of Transportation publishes broad BEV charging-time ranges. These are US reference categories, not European product guarantees, but the width of each range makes an important point: equipment type alone does not determine one fixed charging time.
| US DOT category | Published BEV reference | Why the range is broad | European buyer takeaway |
|---|---|---|---|
| Level 1 | 40–50+ hours to 80% from empty | Low AC power and varying battery size | Do not transfer the US 120 V label directly into a European specification |
| Level 2 | 4–10 hours to 80% from empty | Power, battery capacity and onboard charger differ | Specify phase, voltage, current and rated AC power |
| DC fast charging | 20 minutes to 1 hour to 80% | Charger power and vehicle curve vary substantially | Compare a defined vehicle and SOC window, not the “fast” label |
The ranges and their US scope can be checked in the Department’s Charger Types and Speeds guidance. For Europe, the RFQ should state actual AC/DC power, phase, voltage, current and connector requirements rather than rely on US level terminology.
Worked Procurement Example: 160 kW Can Be Slower Than 120 kW
The two proposals below are fictional and exist only to demonstrate quotation normalisation. Vehicle X operates around 400 V during the comparison and can accept at least 150 kW. The site can supply either charger fully.
| Item | Fictional Proposal A | Fictional Proposal B | Buyer interpretation |
|---|---|---|---|
| Headline rating | 160 kW | 120 kW | Proposal A looks faster on the first page |
| Maximum current | 200 A | 300 A | Current changes available power at a given vehicle voltage |
| Theoretical power at 400 V | 400 V × 200 A = 80 kW | 400 V × 300 A = 120 kW | Proposal B can be faster for this operating point |
| Ideal time for 40 kWh at that point | 30 minutes | 20 minutes | 10 minutes shorter, or 33% less time than Proposal A, before taper and losses |
The lesson is not that 120 kW is generally better. At a higher vehicle voltage, Proposal A may reach its 160 kW rating and become faster. The lesson is that charging speed vs charging power must be compared at the vehicle’s operating voltage. Headline kW, maximum current and voltage range belong in the same evaluation table.
Three KPIs to calculate from session logs
| KPI | Formula | Decision supported |
|---|---|---|
| Average session power | Metered kWh ÷ active hours | Peak-versus-sustained performance |
| Energy-delivery success | Sessions meeting required kWh ÷ eligible sessions | Whether vehicles actually leave ready |
| Active-to-connected ratio | Active charging minutes ÷ plugged-in minutes | Whether the bottleneck is power or parking occupancy |
What Data Should Be in the RFQ?
| Required supplier data | Minimum detail | Why the buyer needs it |
|---|---|---|
| Output envelope | Power available across voltage and current range | Checks low- and high-voltage vehicle compatibility |
| Power sharing | Allocation matrix for one and multiple active connectors | Predicts simultaneous-session performance |
| Derating | Temperature and altitude conditions | Avoids treating laboratory maximum as year-round output |
| Session evidence | Power-versus-time log with SOC and test conditions | Separates peak from average performance |
| Efficiency | Load point, voltage, temperature and meter boundary | Makes energy and cost comparisons valid |
| Acceptance test | FAT/SAT limits, instruments and pass/fail criteria | Turns brochure claims into a contractual check |
Compare chargers using your actual duty cycle
Prepare the vehicle list, arrival SOC, required kWh, departure time, simultaneous sessions and available site power.
Charging Speed and Power FAQ
Why is a 350 kW charger only delivering 100 kW?
The vehicle may be limited to 100 kW at that SOC and temperature. Other possibilities include power sharing, site load management, charger derating or a voltage/current mismatch. Check the full session log before assuming a fault.
Is 50 kW fast charging?
It is commonly classified as DC fast charging, but “fast enough” depends on the energy target and dwell time. At a constant 50 kW, an ideal 50 kWh transfer takes one hour; the real session can take longer.
Why does charging slow near 80%?
Many vehicles reduce requested power as SOC rises. The exact taper differs by vehicle and battery condition, so 80% is a useful planning convention rather than a universal threshold.
Should a buyer compare peak power or average power?
Use both, but base the commercial decision on energy delivered in the available time, average power over a defined SOC window and vehicles served per bay. Peak power alone cannot predict throughput.
What is the clearest way to compare charging speeds?
Use the same representative vehicle, arrival SOC, target SOC, battery condition, active connectors and meter boundary. Then compare total time and kWh delivered—not isolated dashboard peaks.
Conclusion: Compare Energy by Deadline, Not Labels
The difference between charging speed and charging power becomes clear when the numbers are separated. kW describes the rate available at a moment. kWh describes the energy transferred. The vehicle’s charging curve, voltage/current limits, shared site power and available time determine the real outcome.
For commercial procurement, the most useful question is not “Which charger has the largest kW number?” It is “Which configuration delivers the required kWh to every priority vehicle by its deadline, under realistic simultaneous demand?”