1. Global Development of the Electric Vehicle Charging Station Business in 2025
Overview
The business of charging infrastructure for electric vehicles (EVs) is now entering a critical phase globally. According to the International Energy Agency (IEA) Global EV Outlook 2025, public charging points worldwide saw very strong growth – for example, in Europe the number of public points grew by more than 35 % in 2024 compared to 2023. (IEA)
Globally:
- Fast chargers (defined as >22 kW and <150 kW) reached about 2 million units by end of 2024. (IEA)
- Ultrafast chargers (≥150 kW) accounted for nearly 10 % of fast chargers in 2024, and grew by >50 %. (IEA)
- Market size estimates vary: one source projects the global EV charging station market (value) to grow from ~US$21.80 billion in 2025 to ~US$414.36 billion by 2033 (CAGR ~44.5 %). (Straits Research) Another shows a forecast from ~US$28.47 billion in 2025 to US$76.31 billion by 2032 (CAGR ~15.1 %). (MarketsandMarkets)
- Regional breakdown: For Asia-Pacific, the AC EV charging station market size was estimated at US$15.8 billion in 2024, projected to reach US$19.8 billion in 2025 (CAGR ~16.6 %). (Global Market Insights Inc.)
- In Europe: The charging infrastructure market (value) in Europe was estimated at USD 10.8 billion in 2024, projected (2025-2034) to reach USD ~144.9 billion (CAGR ~29.3%). (Global Market Insights Inc.)

Source:https://www.towardsutomotive.com
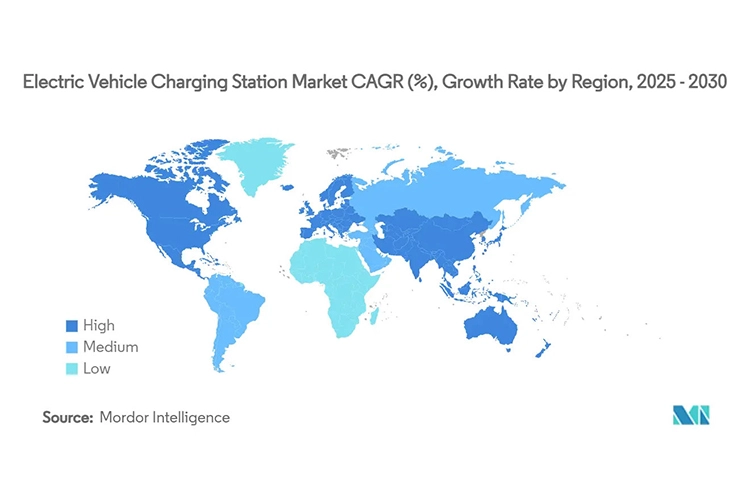
Source:Mordor Intelligence
Key observations & business implications
- Rapid growth of public charging infrastructure: The ratio of public chargers per EV is improving, though still far from universal coverage or convenience in many markets.
- Shift to higher power: With battery ranges increasing and charging-time expectations shortening, fast and ultra-fast charging stations are becoming more prominent.
- Regional leadership and divergence: China remains dominant in scale (particularly fast charging) but Europe, North America, and many Asia regions are catching up. The IEA notes that the combined stock of top 15 cities in China covers more than 50 % of the national public charger stock, versus ~25 % for Europe’s top 15 cities. (IEA)
- Plug-in business model evolution: It is no longer just about hardware, but digital services, network management, energy management (grid & renewables integration), fleet charging (commercial/industrial), and value-added services.
- Opportunity for new entrants and incumbents: Companies focusing on manufacturing charging stations, software platforms, installation & operation services, utility/grid integration, and site-hosting (ev parking, retail, highway, depot) have strong upside.
- Challenges remain: High installation cost, grid-connection issues, standardisation, user experience (charging speed, reliability, availability), and business model clarity (especially in low-utilisation markets). For example, a study by Roland Berger found in Europe charging anxiety is still a barrier: without collaboration between investors, charge-point operators and automotive OEMs, infrastructure may lag EV production. (安永)
Chart/trend recommendation
For this section, a global trend-chart showing cumulative number of public charging points (say 2020-2025) and growth in fast/ultra-fast charger share would be valuable. The IEA report provides data (see Global EV Outlook 2025). (IEA) Many market‐research providers (e.g., MarketsandMarkets, Grand View Research) also provide graphical forecasts.

Source:Market.us
2. Situation in Five European Countries
Here we provide a country-by-country snapshot of the EV charging station business (public charging infrastructure) in five European markets: Netherlands, Germany, France, United Kingdom, Italy.
Netherlands
- According to Workersbee data, the Netherlands in 2025 had approx. 10 chargers per 1,000 people, average speed ~18.4 kW, and BEVs per 1,000 people ~32.6. (workersbee.com)
- The Netherlands has among the highest charger density, making it a mature market in Europe.
- Business implications: high utilisation potential, strong home-charging supportive infrastructure, opportunities for ultra-fast highway/hub chargers and network optimisation

Source:Mobilityportal
Germany
- Germany is among Europe’s largest markets: The IEA notes Germany had ~160,000 public charging points at end of 2024. (IEA)
- Workersbee: For Germany in 2025, approx. 1.9 chargers per 1,000 people, average speed 43.9 kW, BEVs per 1,000 people ~24.1. (workersbee.com)
- Business implications: major growth potential, increasing fast/ultra-fast charger rollout. Site opportunities along highways, urban access, fleet charging (commercial/municipal).

Sources: schnellladepark.app and goingelectric.de
France
- France had ~155,000 public charging points at end of 2024. (IEA)
- According to Workersbee: approx. 2.3 chargers per 1,000 people, average speed ~33.2 kW, BEVs ~20.2 per 1,000 people in 2025. (workersbee.com)
- Business implication: moderate charger density, still significant expansion required, particularly in ultra-fast/high-power segments and rural/hinterland coverage.

Source:Gireve

Source:Gireve
United Kingdom (UK)
- According to Zapmap: as of September 2025, UK had ~86,021 public charging points across ~43,507 locations, ~114,486 EVSE (equipment) and ~120,700 connectors. Rapid/Ultra-rapid (50–149 kW and 150 kW+) devices numbered 17,356. (Zapmap)
- Business implication: strong market but with clear growth path especially in ultra-fast/High-Power Charging (HPC), network interoperability, customer-experience improvements.
Italy
- According to the Workersbee table: Italy in 2025 had approx. 1.0 charger per 1,000 people, average speed ~33.9 kW, BEVs per 1,000 people ~5.1 (i.e., fairly early stage). (workersbee.com)
- Business implication: emerging market within Europe; potentially attractive for first-mover deployment of fast/ultra-fast charging hubs, PPP (public-private partnerships) with local municipalities, and roadside/hospitality-hosted chargers.
Summary Table
| Country | Approx. chargers per 1,000 people | Key metric (speed/kW) | BEVs per 1,000 people | Business focus |
|---|---|---|---|---|
| Netherlands | ~10 | ~18.4 kW | ~32.6 | Mature market, optimisation & HPC |
| Germany | ~1.9 | ~43.9 kW | ~24.1 | Scaling fast/ultra fast, highway hubs |
| France | ~2.3 | ~33.2 kW | ~20.2 | Expand rural/fast chargers |
| UK | ~2–3 (based on ~86k points) | rapid/ultra-rapid: 17,356 | — | Ultra-fast growth, user experience |
| Italy | ~1.0 | ~33.9 kW | ~5.1 | Emerging growth, high potential |
Key take-aways for Europe
- There is a wide variation across countries in charger density, charging speed and BEV penetration.
- Markets like Netherlands are mature and shifting to optimisation; others like Italy are still ramping.
- For companies developing charging station business, Europe offers both mature-market opportunities (upgrade/expansion, high-power charging) and emerging-market opportunities (green-field deployments, highway/fleet infrastructure).
- The regulatory environment is supportive: for example, Europe’s public charging capacity is projected to reach 115 GW by 2030 in the ‘STEPS’ scenario. (IEA)
3. Situation in Five Central Asian Countries
Here is an overview of the EV charging station business environment in five Central Asian countries: Uzbekistan, Kazakhstan, Kyrgyzstan, Tajikistan, Turkmenistan. Note the depth of data is more limited compared to Western markets.
Uzbekistan
- Uzbekistan has emerged as a regional leader. According to one guide: the government mandates 2,400 charging stations over two years, and by February 2025 public parking spaces must allocate at least 5% of spots for EV chargers. (anariev.com)
- Imports of EVs in 2025: about 24,095 EVs + 17,480 hybrids, accounting for ~55.7% of total imported passenger cars. (anariev.com)
- Business implication: rapid growth of demand for charging infrastructure, strong government policy push, good opportunity for early-mover infrastructure developers, site-hosting at public and commercial locations.
Kazakhstan
- Kazakhstan is slightly further behind but growing. New construction norms (April 22, 2025) mandate EV charging stations in urban/rural settlements, gas stations, parking lots and roadside facilities. (anariev.com)
- Imports: in 2025 about 6,875 EVs from China (36-fold increase from prior) in the context of Central Asia growth. (外交家)
- Business implication: large geography with green-field sites, need for highway corridor charging, grid/integration challenges, and opportunity for charging network operators.
Kyrgyzstan
- While detailed charger count is scarce, Kyrgyzstan remains a key import market of Chinese EVs and is part of Central Asia’s emerging EV infrastructure story. (外交家)
- Business implication: nascent market; opportunities for infrastructure deployment, pilot programmes, charging station clusters in capital and transit corridors.
Tajikistan
- Tajikistan has granted decade-long tax exemption for EV imports, indicating encouragement of EV adoption. (外交家)
- Business implication: opportunity to deploy charging stations ahead of mass EV penetration; construction of charging corridors could give first-mover advantage.
Turkmenistan
- Data is very limited publicly for EV charging infrastructure. The region remains early stage.
- Business implication: riskier but potential high reward; may require partnerships with local governments/energy utilities, careful regulatory assessment.
Summary
While Central Asia is less advanced than Western Europe or East Asia in charging infrastructure, the growth tail-winds are strong: EV imports are rising, governmental incentives are emerging, and charging corridors (particularly along transit routes) are becoming strategic. For a company expanding in this region, it may make sense to prioritise: major urban centres, highway/inter-city charging corridors, partnerships with oil/gas-station networks, and flexible business models (fleet-charging, commercial sites).
4. Situation in Three Southeast Asian Countries
We examine the business context in three Southeast Asian countries: Thailand, Indonesia, Vietnam.
Thailand
- According to Roland Berger’s EV Charging Index 2025 expert insight: 40 % of EV drivers in Thailand find charging infrastructure insufficient (which is better than the regional average 49 %). (Roland Berger)
- As of 2025, new EVs account for about 13-18 % of car sales in Thailand, Indonesia, and Vietnam, with annual growth rates exceeding 41 %. (liahnson.com)
- Business implications: Growing market, demand for public charging rises, opportunity for network operators, especially in urban areas and along tourist/commuter corridors.
![]()
Source:Potloc, Roknd Berger Ev chorging index survey 2025
Indonesia
- Target: According to IEA, Indonesia aims to reach 30,000 charging stations by 2030 across Southeast Asia. (IEA)
- According to Reuters: VinFast planned to install up to 100,000 charging stations in Indonesia. (Reuters)
- Business implication: Large population, future market scale, high energy resource potential (nickel for batteries, etc), but infrastructure currently limited — opportunity for major roll-out.
Vietnam
- Vietnam ranked as Southeast Asia’s second-largest EV market (first eight months of 2025: nearly 90,000 units sold). (VNExpress国际)
- Business implications: Strong adoption curves, growing charging infrastructure need, opportunities in both public and workplace/residential charging.

Source:Imarc
Cross-Country observations
- According to a market-report: Southeast Asia Electric Vehicle Charging Equipment Market volume is estimated at 14.33 thousand units in 2025 and expected to reach 43.05 thousand units by 2030 (CAGR ~24.61 %). (Mordor Intelligence)
- Charging equipment is growing but site-host deployment, grid integration, power quality, reliability, and business models are still challenges given infrastructure maturity.
- For a company: priority site types include urban public chargers, workplace/residential, highway hubs/tourist routes, fleet depots (logistics/ride-hailing). Charging station business models might include subscription, pay-per-use, bundling with parking/retail services, energy-storage integration.
5. Situation in Three Other Asian Countries
Here we highlight three further countries in Asia to illustrate varying stages of EV charging infrastructure development: China, India, Japan.
China
- China remains the global leader. The IEA notes that China was responsible for ~80 % of global growth in fast chargers in 2024 (fast chargers rising from ~1.2 million to ~1.6 million). (IEA)
- Business implication: high scale, mature market, intense competition. For an international company there may be advanced-technology niche opportunities (ultra-fast, smart-charging, network software) rather than mass installation.

Source: Roland Berger Ev charging index 2024 survey
India
- According to IEA: number of public charging points in India increases from ~75,000 at end of 2024 to ~375,000 by end of 2030 in STEPS scenario. (IEA)
- Business implication: early-stage market compared to China, high growth potential, pricing sensitivity, opportunity in suburban/municipal rollout, fleet charging.

Source:Imarc
Japan
- Among other countries in Asia, Japan is targeting ~300,000 public charging points by 2030 (approx. nine times the stock at end of 2024). (IEA)
- Business implication: mature utility & grid environment, expectation of higher-service level charging, integration with renewable energy and smart grid.

Source:www.grandviewresearch.com
6. Key Areas for a Company to Develop a Charging Station Business

For a company aiming to develop or expand in the charging-station business, the following key areas should be considered:
6.1 Site selection & hosting
- Identify high-value locations: highway/interstate corridors, urban centres, shopping malls/retail destinations, residential complexes, workplaces, logistics depots.
- Analyse utility grid capacity, land/parking lease, permitting/regulatory constraints, user access/convenience.
- Partnerships: site host (retail, hospitality, fleet), local municipality, utility.
6.2 Hardware & technology specification
- Determine charger types: AC slow chargers (Level 2) for overnight/park-and-charge; DC fast chargers (50-150 kW); ultra-fast/high-power chargers (150 kW+ up to 350+ kW).
- Consider standards (connector types: CCS, CHAdeMO, NACS in some markets), interoperability, future-proofing (higher power, multiple ports).
- Manage installation cost, grid connection cost, civil works, cooling/thermal management for high-power units.
6.3 Software, network & user experience
- Platform for charge-point monitoring, remote management, load balancing, demand management.
- User interface: apps, payment systems, reservation, real-time availability.
- Integration with broader mobility services: vehicle-to-grid (V2G), energy storage, renewable energy integration, fleet management.
- Data analytics: utilisation forecasting, dynamic pricing, uptime/reliability tracking.
6.4 Energy & grid integration
- Assess and manage demand charges, peak loads, utility tariffs. In many markets the cost of grid connection and power increases can be major.
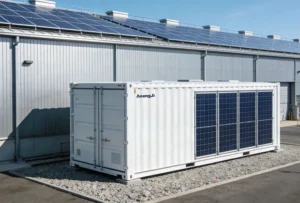
- Consider use of on-site energy storage, solar canopy, smart-charging (load-shifting) to reduce grid impact and operating cost.
- For large hubs, coordination with utility for upgrades or incentives (particularly in markets with minimal infrastructure yet).
6.5 Business model & commercial strategy
- Revenue streams: pay-per-use, subscription/membership, value-added services (shop/retail partner parking, advertising, fleet contracts).
- Site hosting models: revenue-share with property owner, service-provider model (operator handles everything).
- Fleet charging (ride-hailing, delivery/logistics) offers higher utilisation and stable demand, important for return on investment.
- Scalability & network effect: as number of stations increases, network effects/brand matters (ease of access, reliability).
- Market differentiation: fast/ultra-fast, multi-port hubs, luxury/resort sites, integrated services (EV rental, valet charging, destination hospitality).
6.6 Regulation, incentives & funding
- Monitor government incentives/subsidies for charging-station deployment, tax breaks, low-interest financing, grid-upgrade assistance in many markets (e.g., Uzbekistan, Indonesia).
- Understand local permitting regimes, utility rules, interconnection processes.
- Sustainability credential: green-energy charging, zero-emission alignment helps in many jurisdictions.
6.7 Risk management & operational excellence
- Guarantee uptime and quality of service (charging plugs working, reliability). In nascent markets, user experience matters a lot to EV adoption.
- Maintenance, remote monitoring, warranty/servicing.
- Future-proofing given rapid tech change (higher power chargers, battery-swap alternatives, new connector standards).
- Managing utilisation: many chargers are under-utilised especially in early stage markets — careful financial modelling and flexible deployment (scalable modules).
7. Forecast Global Trends in the Charging Station Business by 2030

Source:www.grandviewresearch.com
7.1 Market growth trajectory
- Based on the global forecasts: the charging station market is expected to grow significantly. For example, one estimate shows growth from ~US$21.80 billion in 2025 to US$414.36 billion by 2033 (CAGR ~44.5 %). (Straits Research)
- Another forecast shows growth from ~US$28.47 billion in 2025 to US$76.31 billion by 2032 (CAGR ~15.1 %). (MarketsandMarkets)
- Regionally: e.g., Europe projected public charging capacity to reach 115 GW including slow and fast chargers by 2030 in IEA’s STEPS scenario. (IEA)
7.2 Key trend-areas by 2030
- Ultra-fast/high-power charging hubs: Increasing share of chargers will be high-power (150 kW+). The IEA projects the share of fast chargers in Europe to increase from <20 % in 2024 to ~30 % by 2030. (IEA)
- Network effect & interoperability: More unified, cross-border and multi-brand networks; roaming/brand-agnostic access; membership and subscription models.
- Integration with renewables & grid services: Charging stations will increasingly pair with solar, battery-storage, vehicle-to-grid (V2G) services, demand-response.
- Fleet & commercial charging dominance: Growth of EV fleets (logistics, ride-hailing, buses) will drive demand for high-utilisation charging stations (depots, hubs).
- Emerging markets expansion: While early growth was concentrated in mature markets, by 2030 large scale rollout is expected in developing markets (e.g., India, Southeast Asia, Africa) offering major growth opportunities.
- Smart charging & digital services: Software platforms, billing/analytics, predictive maintenance, dynamic pricing, grid-optimised charging will become standard.
- Shift from quantity to quality: As charger count grows, key metrics will shift to reliability, speed, uptime, user-experience, ease of access.
- Business model evolution: From hardware + installation only, to network operations, charging-as-a-service, bundling with mobility services, subscription models, energy-services (storage/management).
- Standardisation & future-proofing: Connector standards may consolidate (e.g., CCS globally, NACS, etc). Need for future-proof stations that can upgrade to higher power.
- Rural & underserved coverage: By 2030 the gap between urban and rural charging infrastructure is likely to shrink; long-distance corridor charging becomes standard.

Source:www.grandviewresearch.com

Source:ACEA
7.3 Company strategy implications
- Early movers that build infrastructure now in less saturated markets (emerging countries) may capture leadership and network scale.
- Upgrading existing networks to high-power, higher-service models will be critical in mature markets.
- Strategic partnerships (with utilities, real-estate/host sites, fleet operators) will differentiate.
- Financial modelling must account for utilisation risk, long installation/permits lead-time, and grid-connection costs.
- Monitoring regulatory/electricity tariff trends is essential: favourable incentives are still present but may evolve.
- Real-world user-experience will increasingly drive adoption: reliability, speed, convenient access will matter for competitiveness.
7.4 Where to view trend charts & reference data
- The IEA’s Global EV Outlook 2025 provides charts on charger stock, fast-charging share, regional trends. (IEA)
- Market research firms e.g., Grand View Research, MarketsandMarkets, GMI Insights provide forecast graphs (see sources above: turn0search22, turn0search37, turn0search24).
- Industry reports such as the gridX “Charging Report 2025” (Europe) give visual data sets. (GridX Public)
Conclusion
The charging-station business for EVs stands at a pivotal juncture. Growth in EV adoption is driving enormous infrastructure demand globally, across mature and emerging markets alike. For companies that act strategically—choosing the right sites, deploying appropriate hardware, building software/operational capabilities, integrating with the grid/energy systems, and designing scalable business models—there is a very substantial opportunity.
From Europe’s canals to Central Asia’s vast corridors, from Southeast Asia’s emerging fleets to China’s scale-leadership, the geography is global. By 2030 the landscape will look very different: charging will be faster, smarter, more ubiquitous, and more embedded in energy-mobility ecosystems. This is a horizon that forward-looking companies should prepare for now.